

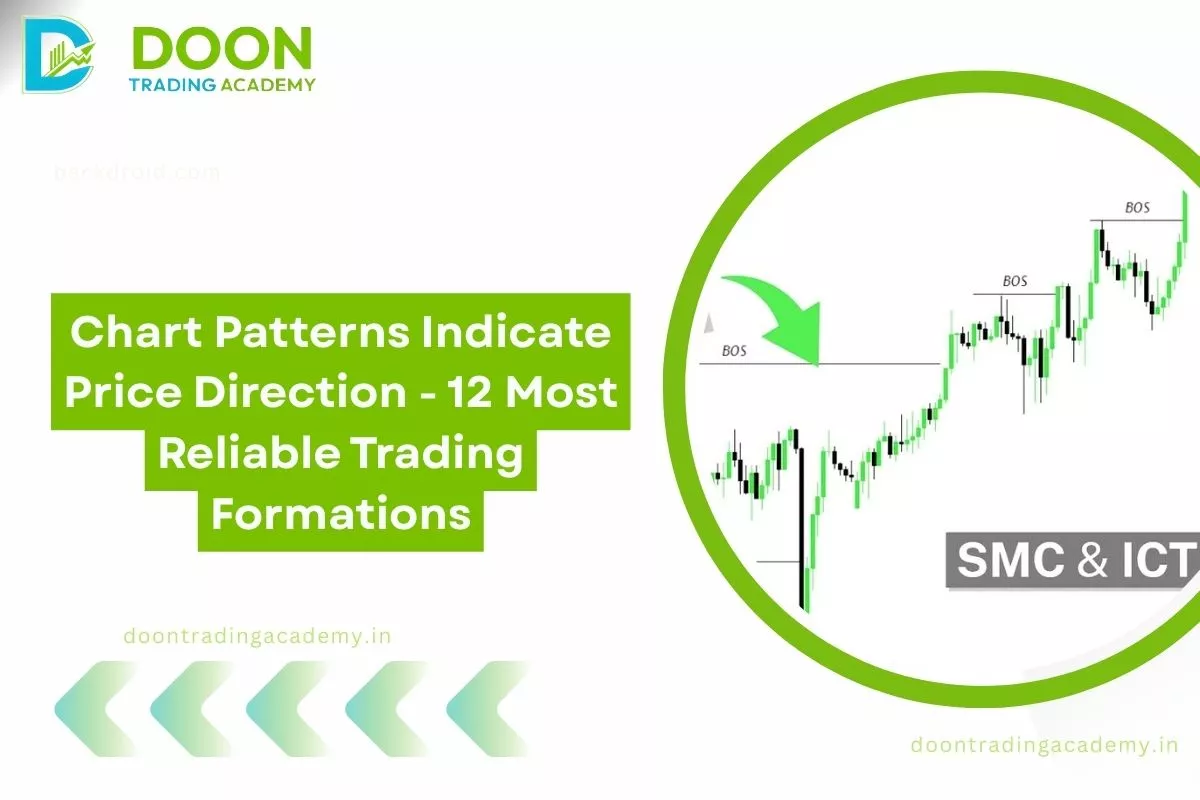
Understanding how chart patterns indicate price direction is one of the most critical skills for anyone trading financial markets, from beginners to advanced professionals. In my experience, learning to decipher these visual roadmaps on your chart has been the difference between guessing and anticipating market moves with real confidence.
Chart patterns are the result of collective market psychology, providing clues to where prices might head next. Not only do these formations offer perspective on the likely future direction, but they also de.r risk parameters and price targets, helping traders manage both their trades and their emotions. By mastering the 12 most reliable trading formations, you can move beyond gut feeling and leverage historically proven setups for trading stocks, forex, or cryptocurrencies.
Quick summary
- Chart patterns reflect repeatable market psychology and behavior, giving advance warning for trend continuation or reversals.
- Volume confirmation and timeframe selection are crucial for dependable signals.
- Pattern reliability has declined in recent years due to algorithmic and high-frequency trading.
- The 12 most reliable formations include: Head and Shoulders, Double Top/Bottom, Triangles, Flags, Pennants, Cup and Handle, Rounding Bottom, Wedges, Rectangles, Channels, Gaps, and Diamond Top/Bottom.
- Risk management and combining patterns with technical indicators significantly improve outcomes.
Understanding Chart Patterns
Chart patterns are recognizable formations created by the price movement of a security, serving as visual footprints for potential market turning points. In technical analysis, these patterns form the backbone of forecasting, as they are believed to repeat over time due to consistent human psychology and behavior in markets.
Patterns emerge as buyers and sellers react to evolving information, showing how consensus builds and reversals take place. As price plots these moves, familiar shapes—such as triangles, wedges, or cup and handles—suggest whether the prevailing trend will likely persist or reverse.
Traders place considerable emphasis on chart patterns because, when combined with volume and market context, history suggests they tip the odds in your favor for predicting future moves. While patterns do not guarantee outcomes, their prevalence across decades and asset classes underlines their predictive power when used with discipline.
Types of Chart Patterns
- Reversal Patterns: Indicate when a prevailing trend is about to change direction. Recognizing reversal patterns can help traders time market entries or exits precisely.
- Continuation Patterns: Signal that a trend is likely to resume following a consolidation. These provide opportunities to join the trend after a brief pause.
- Bilateral Patterns: Show that a significant move is imminent but do not specify direction—these require confirmation before trading.
12 Most Reliable Trading Formations
1. Head and Shoulders
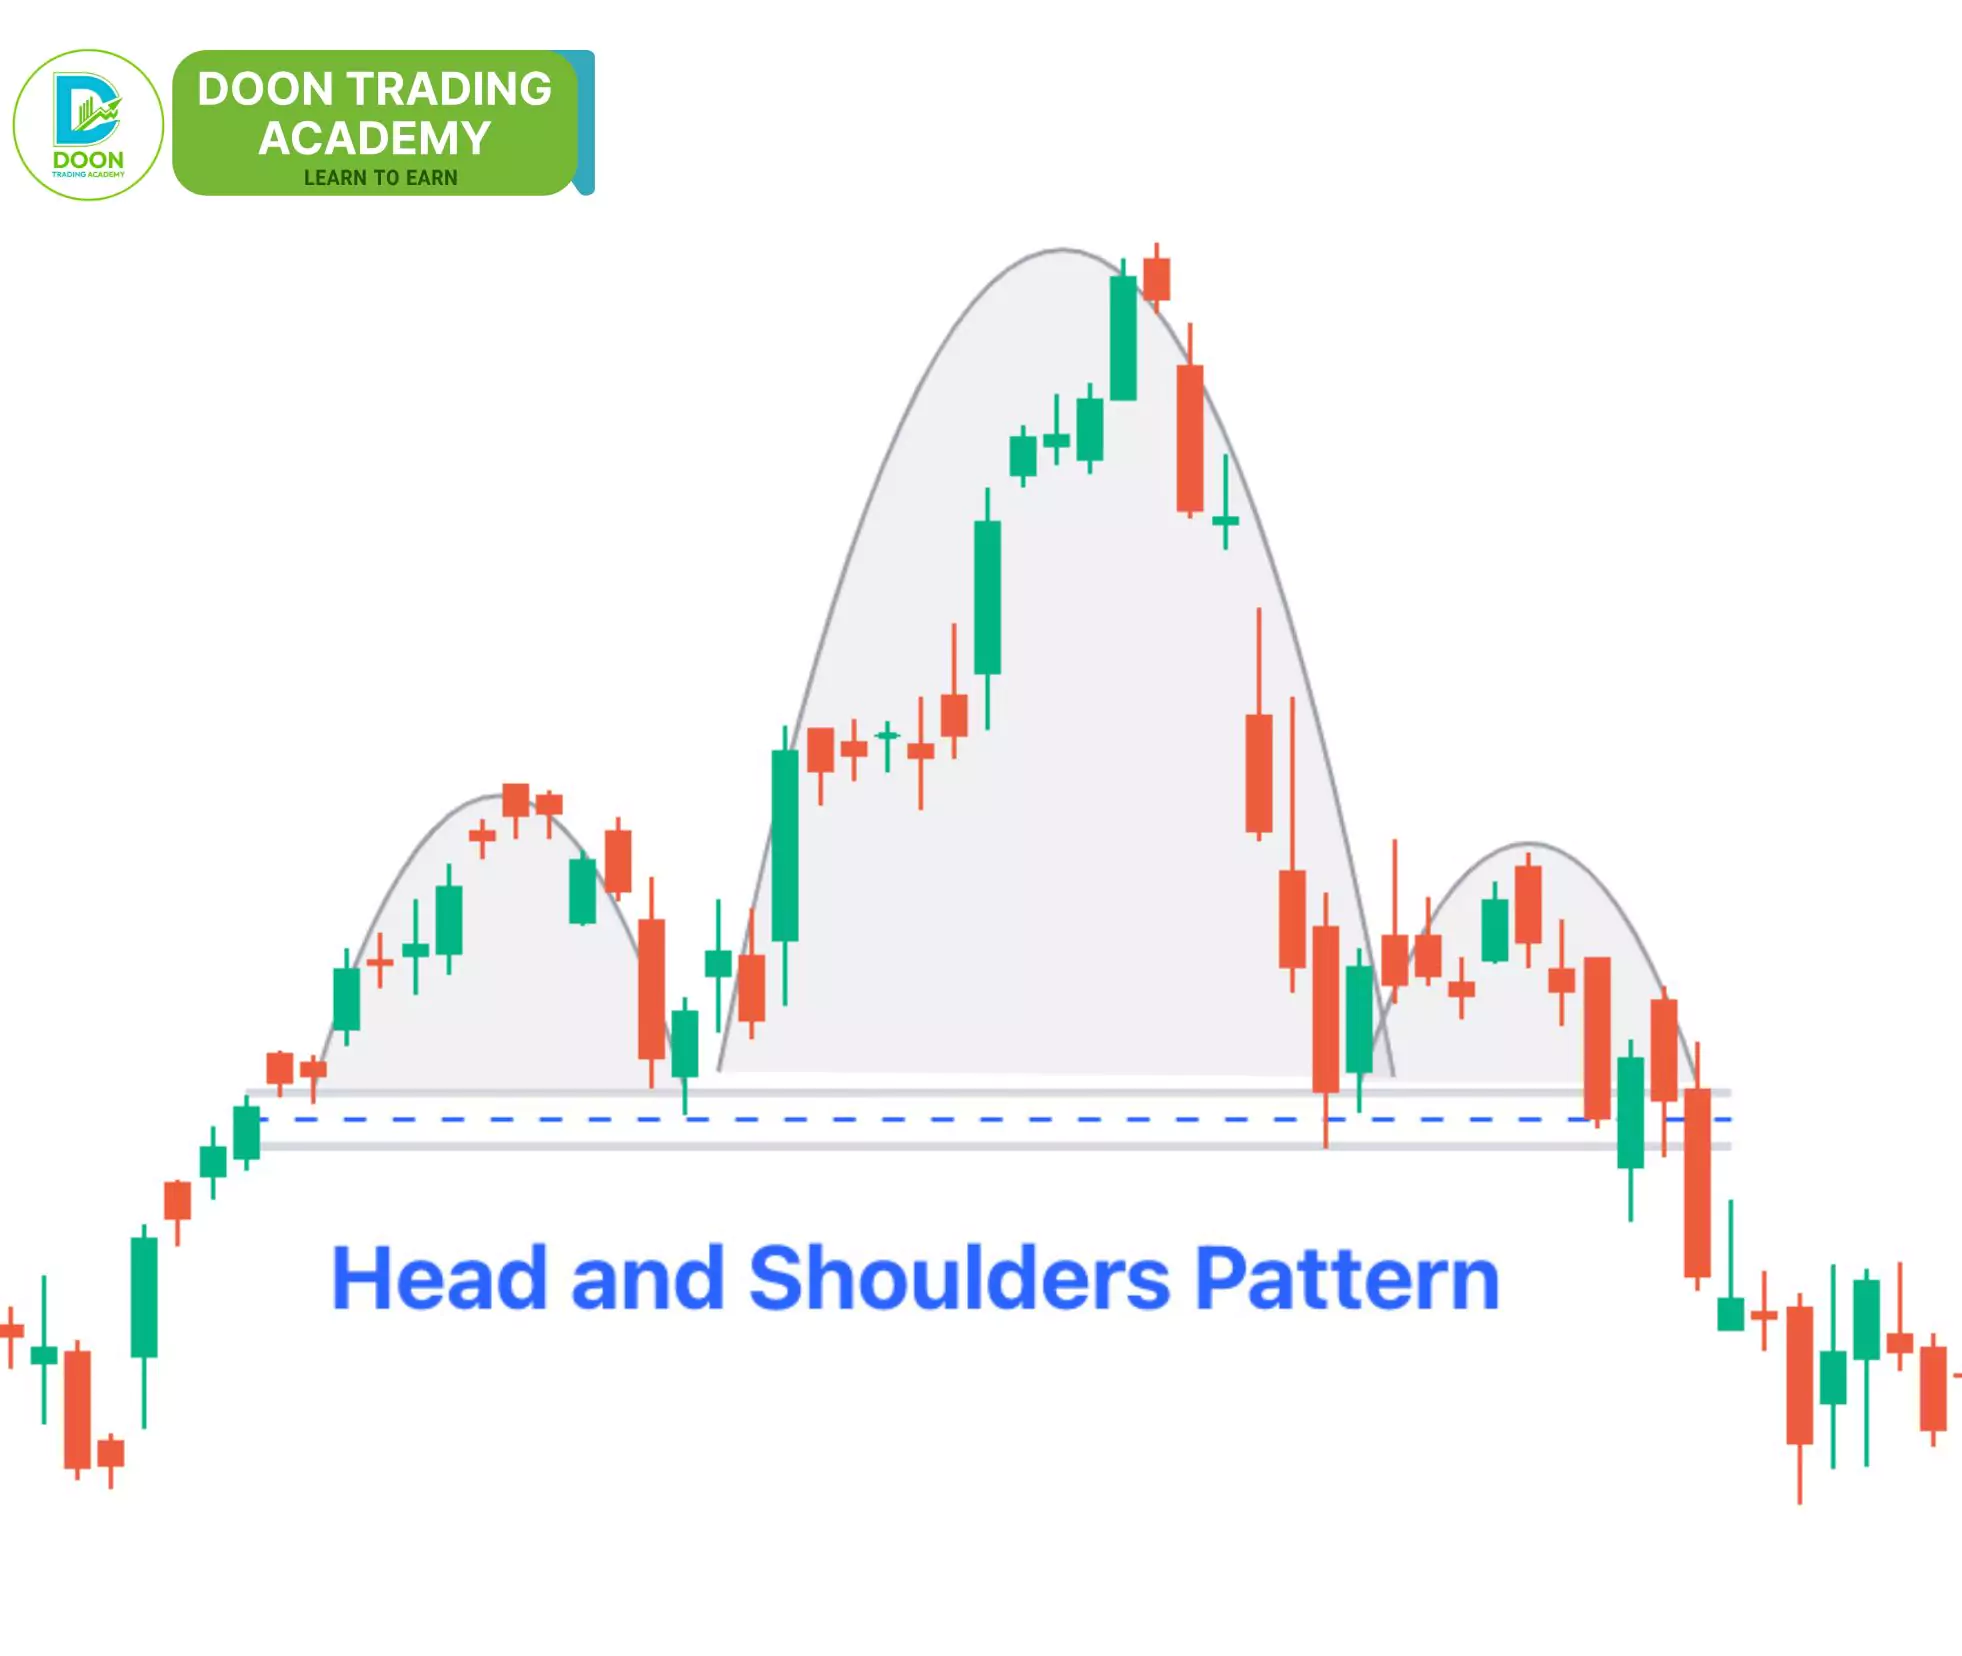
The head and shoulders pattern, often considered the most definitive reversal formation, consists of three peaks: a central higher “head” between two lower “shoulders.” This setup reflects institutional distribution, where large players exit positions as retail traders buy late into the uptrend. The pattern is only confirmed when price breaks the neckline drawn through the troughs, ideally accompanied by a volume surge.
Empirical studies have shown this pattern’s reliability can reach up to 83% for well-formed examples, especially on higher timeframes. In practice, I’ve found that stops are best placed using a “two-candle rule” behind the breakout, which helps avoid whipsaws. Most failed patterns occur on low-volume breakouts, so waiting for confirmation is essential.
- Real-world example: The SPY ETF formed a classic head and shoulders in early 2022, leading to a major correction as the neckline broke on above-average volume.
2. Double Top and Double Bottom
A double top is created when price peaks twice at similar levels with a valley in between, often marking the end of an uptrend. Its mirror image, the double bottom, forms after two significant lows—hinting at trend reversal to the upside. These patterns are notable for their clarity and the mechanical calculation they allow for stops and targets.
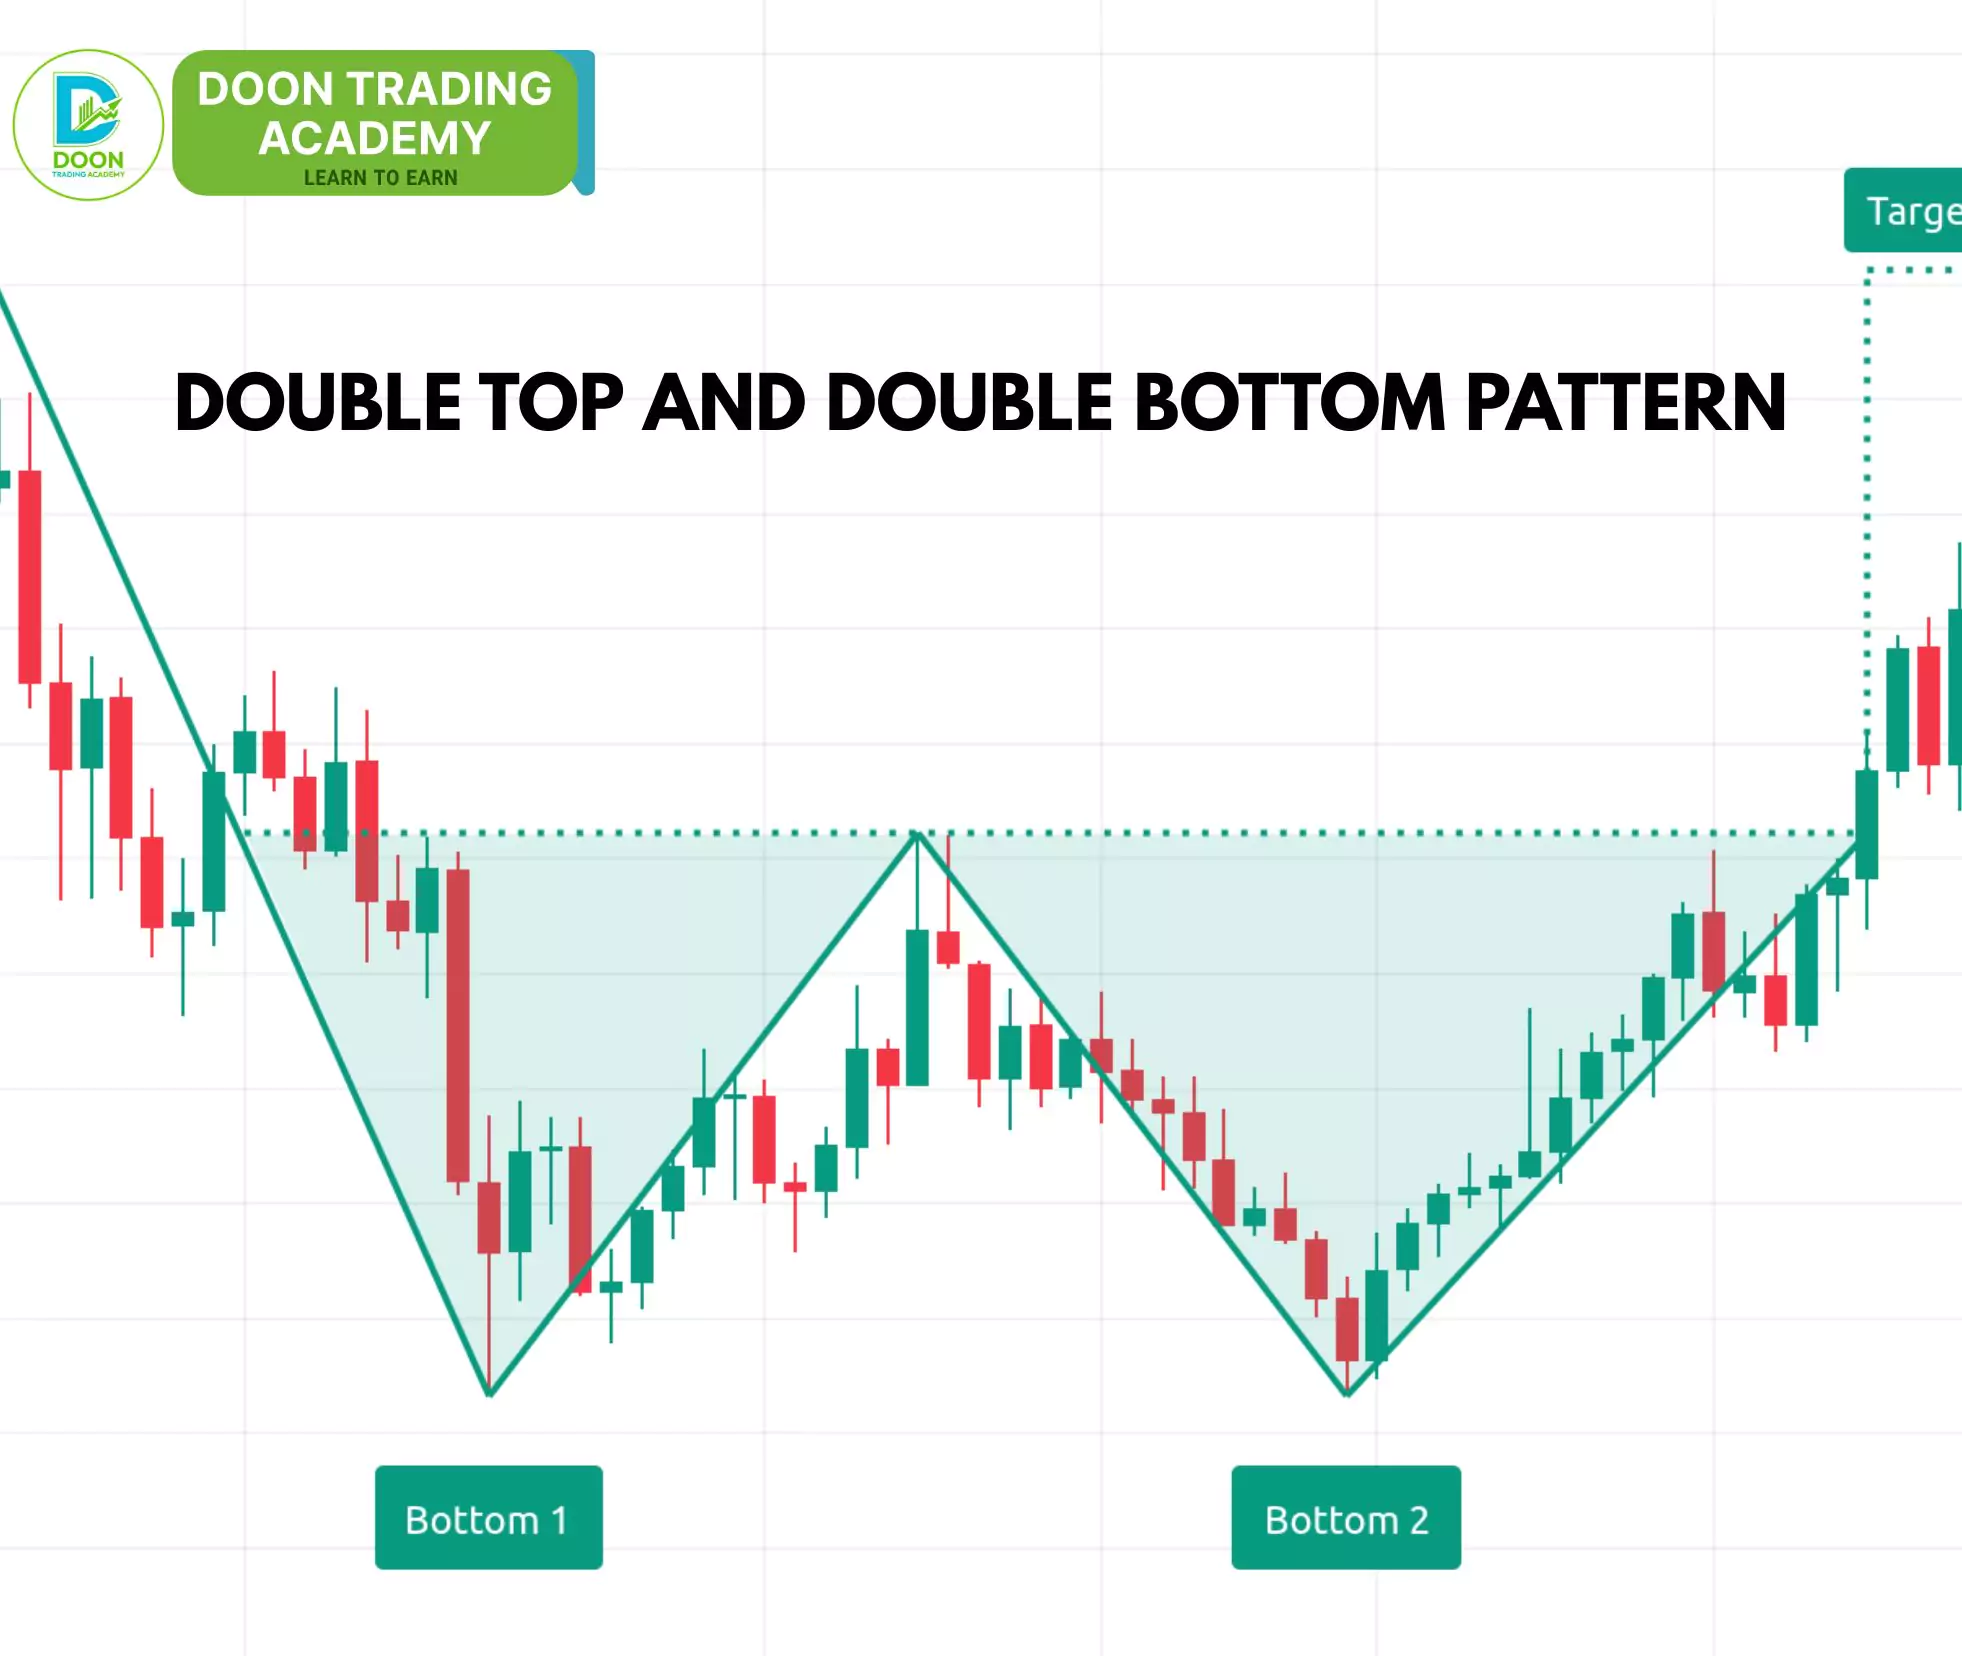
In robust samples, confirmed double tops and bottoms achieve accuracy rates of 75% or more, but failure rates increase if the neckline is not broken with volume support. According to one well-quoted analysis, “Double bottoms are the only pattern I trust for reversals, especially after extended declines.” (from Reddit user: TradeMentor21).
3. Triangles (Ascending, Descending, and Symmetrical)
Triangles illustrate price consolidating into tighter ranges. Symmetrical triangles, with converging trendlines, show no bias until breakout, with about 75% historically continuing in the direction of the prior trend. Ascending triangles (rising lows, flat top) hint at bullish breakouts, while descending triangles (falling highs, flat bottom) presage bearish moves.
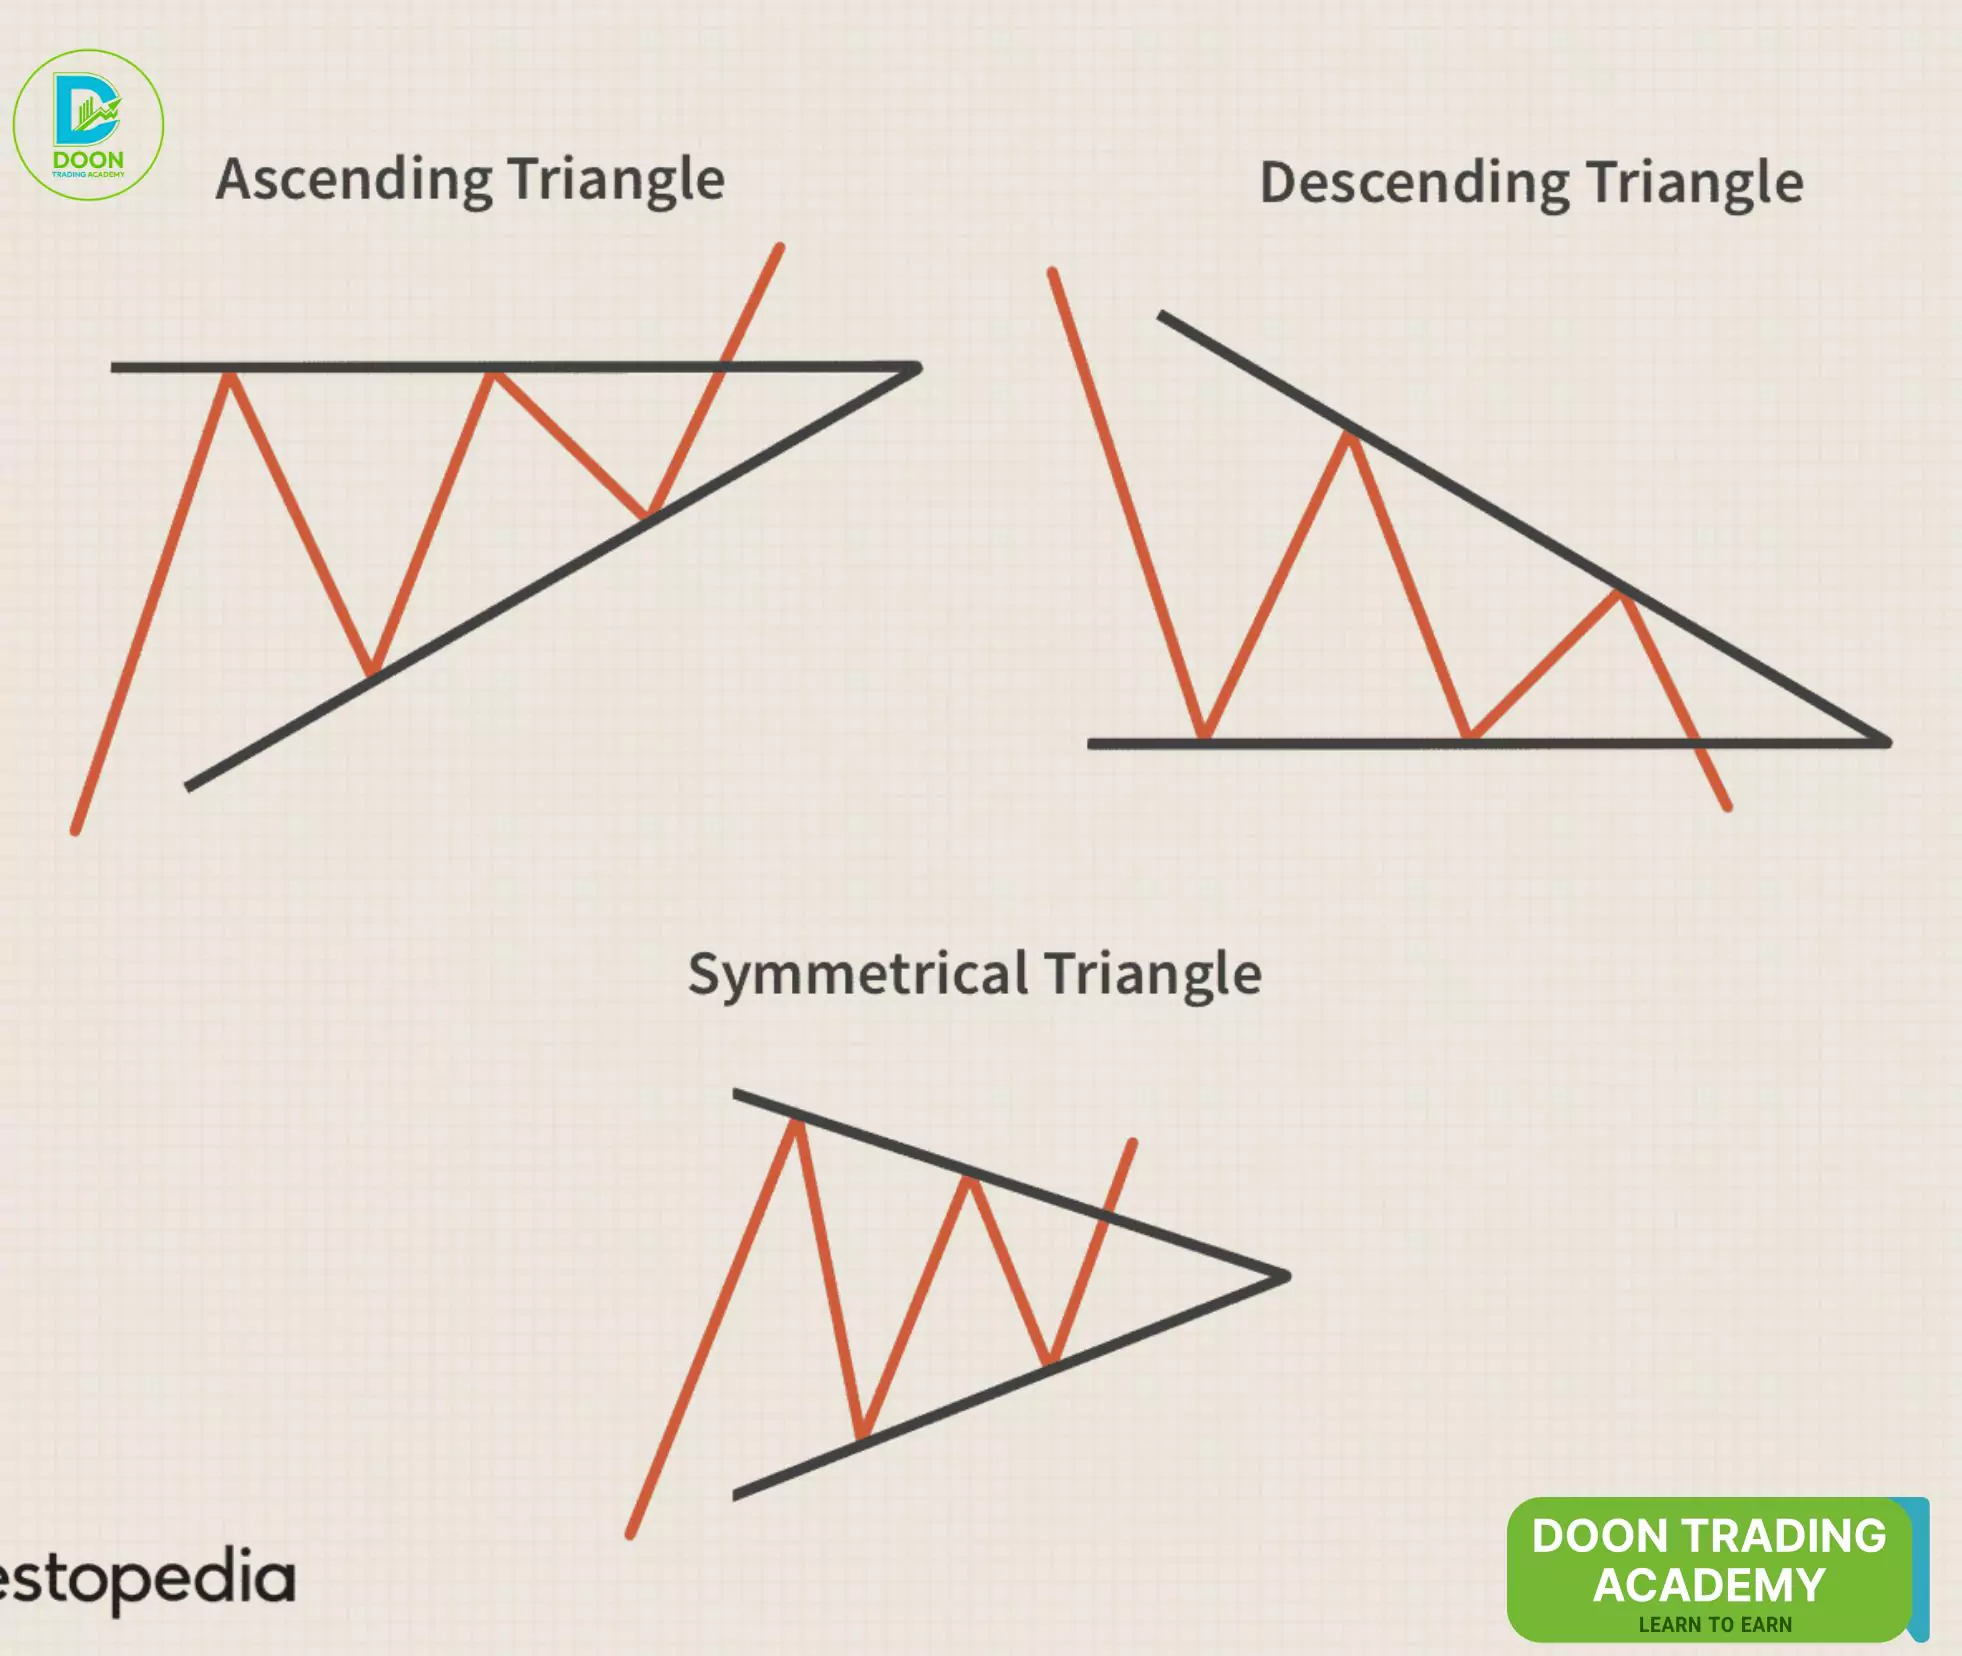
Performance varies, but all types benefit greatly from volume contracting into the apex and surging at the breakout. In my experience, triangles provide measured move targets by projecting the widest part of the formation from the breakout point.
4. Flags and Pennants
Flags are short-term consolidations sloping against the prevailing trend, while pennants are tiny symmetrical triangles after sharp impulse moves. Both are continuation patterns following strong price “poles.” Confirmation comes from breaking out of the consolidation on increased volume.
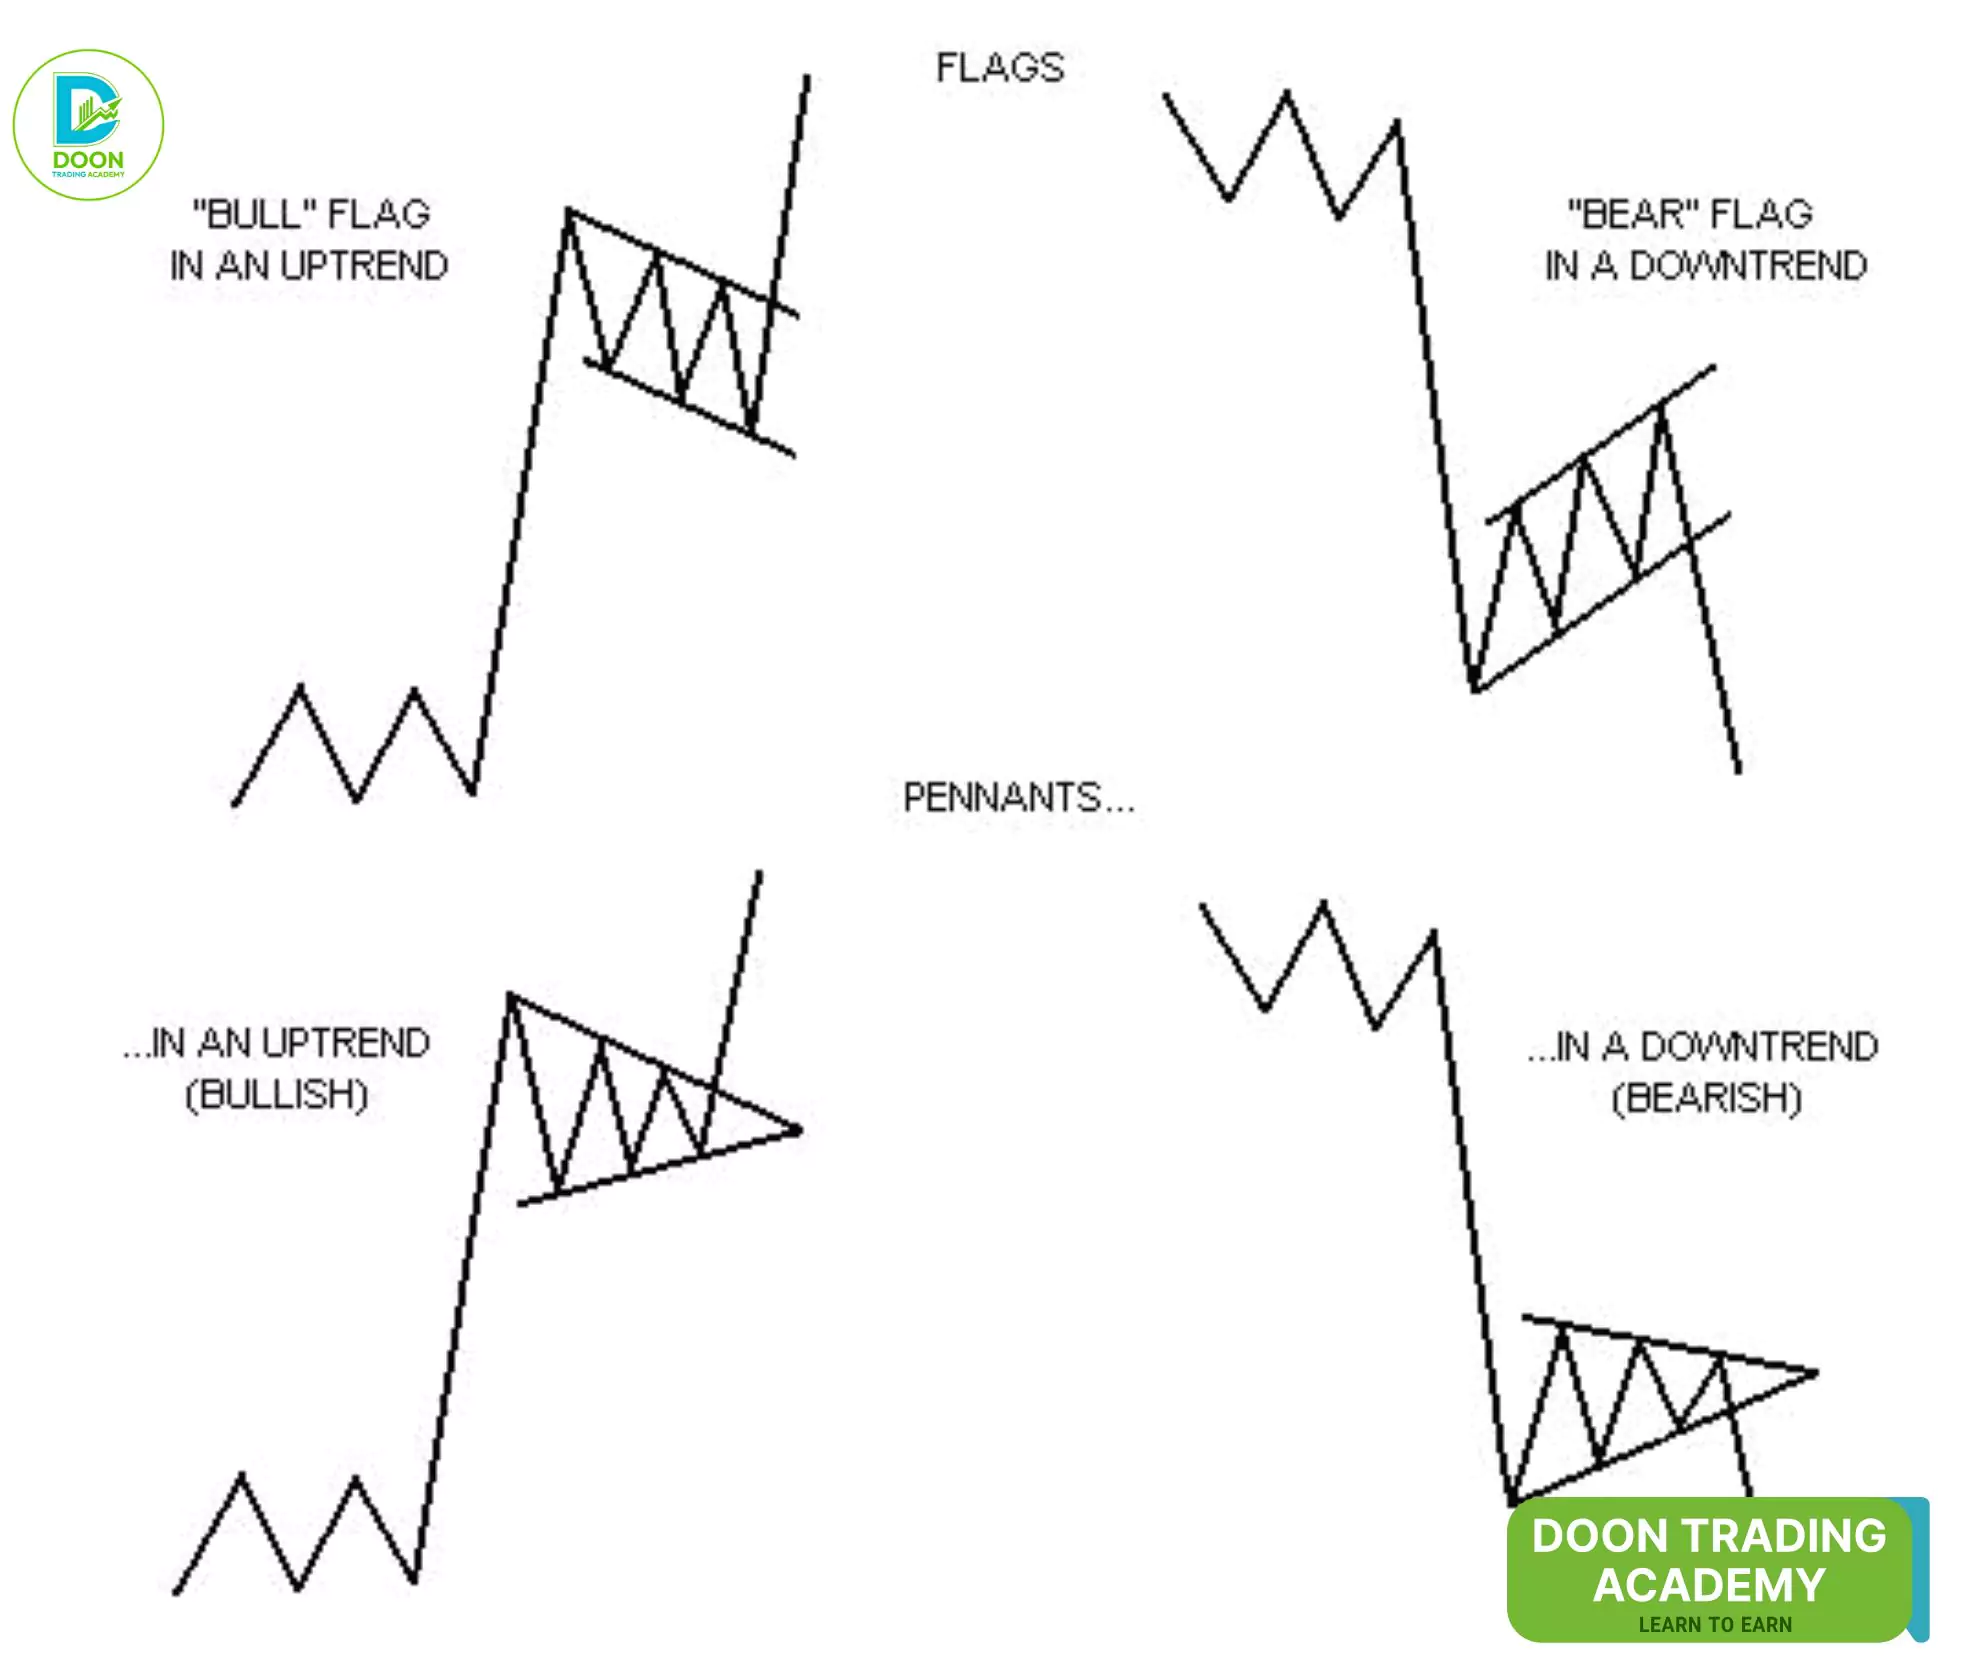
Bull flags and bear flags have shown 67% reliability when timed with the existing trend and volume confirmation. For pennants, the odds drop to about 55% due to frequent noise and false breaks, especially on thinly traded securities.
5. Cup and Handle
Popularized by William O’Neil, this bullish continuation pattern begins with a rounded “cup,” followed by a shallow downward “handle” consolidation. Ideally, the cup should be at least 30 trading days while the handle slopes down gently. Volume dries up at the bottom and increases on breakout above the handle.
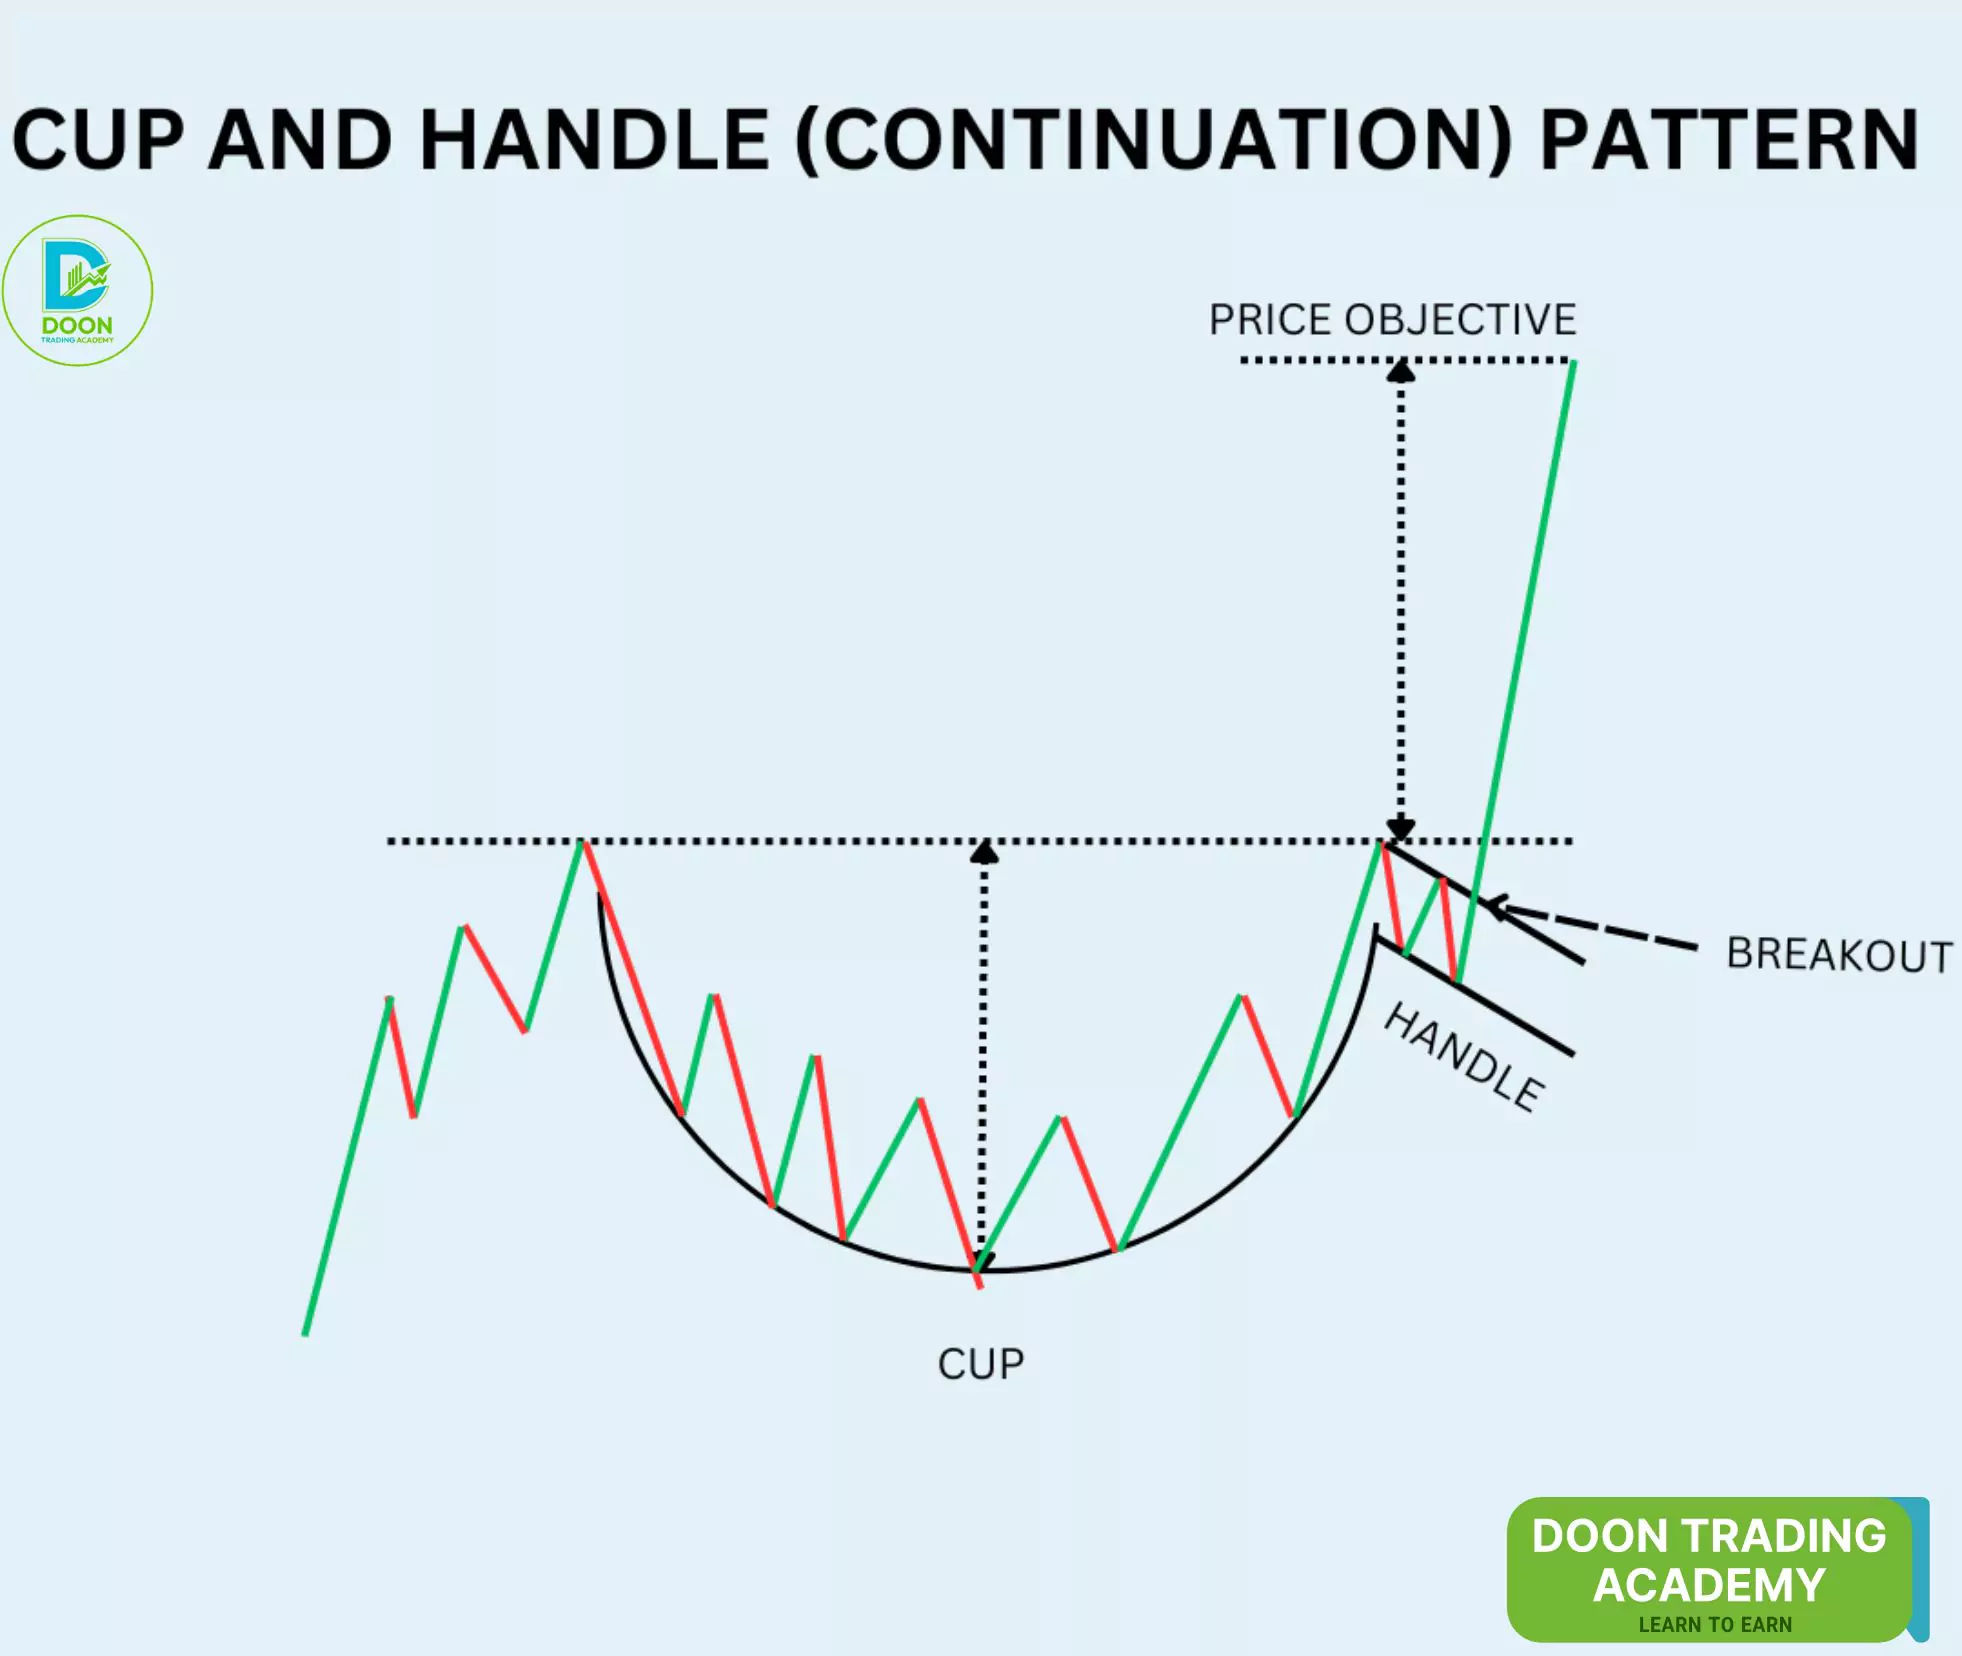
Analysis reveals consistently high win rates—70% for short-term, up to 85% over 10 years. I favor cup and handle setups in leading tech stocks where institutional accumulation is clear, using automatic pattern recognition in charting tools to avoid subjectivity.
- Historical example: The 2004–06 “cup and handle” in Google (GOOGL), which launched a multi-year rally.
6. Rounding Bottom
Sometimes called a saucer bottom, this is a long-duration reversal pattern occurring mostly on weekly or monthly charts. It signals gradual accumulation as selling wanes and buyers steadily take control. These take patience, but once resistance is breached, new trends often develop for months.
I’ve seen this most often following harsh bear markets—traders who wait for breakout confirmation with volume often catch major upside response.
7. Triple Top and Triple Bottom
These formations add a third peak or trough to the classic double top/bottom. They’re slightly less common but imply even greater market exhaustion and heightened chance of a large reversal. Success rates are comparable to double formations when volume confirms.
Professional traders often set tighter stops just outside the third swing, recognizing that a failed triple pattern can result in explosive moves as trapped traders are squeezed.
8. Wedges (Rising and Falling)
Rising wedges are bearish, created by converging higher highs and higher lows. They often signal exhaustion, especially late in uptrends, and once broken, produce rapid declines. However, failure rates can approach 40% if breaker signals are weak or occur within strong bull runs.
Falling wedges appear at the end of downtrends and are distinctly bullish: 82% of these patterns break upward, and nearly 90% reach projected price targets. False breakouts are rare, but waiting for volume expansion avoids “bear traps.”
- Example: 2020 Bitcoin’s falling wedge, which triggered a major bull market post-breakout.
9. Rectangles
Rectangles are ranges bound by horizontal support and resistance, reflecting a temporary equilibrium between buyers and sellers. These can break in either direction, so confirmation is vital. The projected move matches the height of the rectangle measured from the breakout level.
They work well in consolidating phases and provide tight stop and target points. In actively traded assets, volume usually picks up dramatically on the eventual breakout.
10. Falling and Rising Channels
Channels create parallel trendlines marking persistent bullish or bearish moves. Rising channels favor trend following, as price gently steps higher; falling channels do the opposite. These patterns persist until a clear breakout occurs, signalling a reversal or acceleration.
Experienced traders note that trading within channels (“buy at support, sell at resistance”) only works as long as the overall trend remains intact. “Nothing makes me more disciplined than seeing price confined in a channel; it keeps my entries mechanical.” (Reddit: ProPriceAction)
11. Gaps
Gaps—large price jumps between sessions—can signal powerful new moves or exhaustion, depending on context:
- Common gaps occur in choppy markets and usually fill quickly.
- Breakaway gaps mark the start of trends.
- Continuation/runaway gaps confirm trend acceleration.
- Exhaustion gaps often presage reversals.
Context and volume are critical for interpreting gaps. Experienced traders carefully distinguish between signal and noise, especially when gaps appear near prior support/resistance.
12. Diamond Top/Bottom
Diamonds are rare but highly effective at signaling reversals following rapid directional moves. They form as broadening patterns that contract over time, resembling a diamond shape. While relatively infrequent, they often precede sharp, sustained reversals once the pattern is confirmed.
Volume typically decreases during the formation and spikes at breakout, providing a strong confirmation signal.
Comparison Table: Reversal vs. Continuation Patterns
| Reversal Patterns | Continuation Patterns |
|---|---|
| Head and ShouldersDouble/Triple Top & BottomRounding BottomWedgesDiamond Top/Bottom | TrianglesFlags & PennantsRectanglesChannelsCup and Handle |
How to Use Chart Patterns in Trading
Integrating chart patterns into your trading approach requires more than pattern recognition. Here’s how I approach it step by step:
- Start with Trend Analysis: Use trend indicators or moving averages to determine broader market context before searching for patterns.
- Identify Patterns with Volume Confirmation: Wait for a clear break of the pattern with a volume surge. The move should align with the pattern’s implications.
- Use Additional Indicators: Overlay support/resistance, RSI, or MACD to provide extra confirmation and filter low-quality signals.
- Apply Risk Controls: Size your positions so no one trade risks more than 1–2% of your capital. Place stops based on the pattern structure and mechanical measurements (e.g., distance from entry to neckline, or pattern height projection).
- Set Profit Targets: Calculate targets using pattern-projected moves, and consider taking partial profits, trailing stops, or stepping out at the next major support/resistance zone.
Be aware of limitations: Algorithms can trigger false breaks, and not every pattern will work. Failed patterns, however, can create high-reward contrarian opportunities—such as “failed head and shoulders” or “false wedges.” Adapt, don’t blindly follow textbook signals.
Beyond-Common-Sense Facts About Chart Pattern Reliability
- Recent market evolution—particularly algorithmic trading—has doubled the failure rate for some classical patterns since the 1990s.
- Volume is a more reliable confirmation tool for pattern breakouts than pattern shape itself; most failed patterns break on weak volume.
- Falling wedges have a success rate (bullish outcome) of 82%, outperforming both triangles and rising wedges, but only when the handle forms gently and volume contracts.
- Classical reversal setups like head and shoulders and double tops are significantly less reliable on intraday charts due to noise and absence of institutional participation.
- Professional traders often use “failed” patterns as explicit entries, betting against the crowd when textbook setups break the wrong way—this approach leverages stop-loss cascades for profit.
Conclusion
From my journey as a trader, I can say that relying on chart patterns to indicate price direction isn’t about being right every time. Rather, it’s about stacking probabilities in your favor by reading the underlying psychology and momentum that patterns reveal. Patterns like head and shoulders, triangles, and cup and handle aren’t just random shapes—they’re visual signals left by institutional players and repeated market behaviors. But, as I’ve learned, no pattern is foolproof. Confirmation through volume and alignment with higher timeframes are absolutely necessary for robust results.
Here’s a recap of my process and what you can follow too:
- Begin by identifying the major trend using market context and technical indicators.
- Search for reliable chart patterns, focusing on the twelve covered here for best odds of success.
- Wait for clear breakout confirmation with a volume surge and, wherever possible, alignment across multiple timeframes.
- Set stop-losses using structural points from the pattern (like necklines or breakout bars), never risking more than a set percent of your capital per trade.
- Measure and anticipate profit targets based on the pattern’s projection, but be ready to adapt with trailing stops or partial exits.
- Combine charts with technical indicators and never trade patterns in isolation—especially in choppy, sideways, or illiquid markets.
- Keep a detailed journal of each pattern trade to refine your approach over time as market behavior evolves.
If you’re new to pattern trading or want to refine your edge, I strongly recommend demo trading these formations until you’re comfortable spotting, validating, and managing them. What patterns have been most reliable for you? Let me know in the comments—I’d love to hear about your own experiences or any questions you may have.
Additional Resources
- Further Reading: “Technical Analysis of Stock Trends” by Edwards & Magee, “How to Make Money in Stocks” by William O’Neil, and “Encyclopedia of Chart Patterns” by Thomas Bulkowski.
- Charting Software: TradingView, MetaTrader, and StockCharts all provide pattern recognition tools and multi-timeframe analysis.
- Communities: Engage with other traders at Reddit’s r/Daytrading, TradingView Ideas, or the Elite Trader forums for real-world discussions and pattern recaps.
- Courses: Look into Udemy’s “Technical Analysis Masterclass” and the Chart Guys’ YouTube channel for hands-on pattern training and case studies.
Ready to take charge of your trading? Dive in, chart boldly, and keep learning—the patterns are there for those who are prepared to see them.