


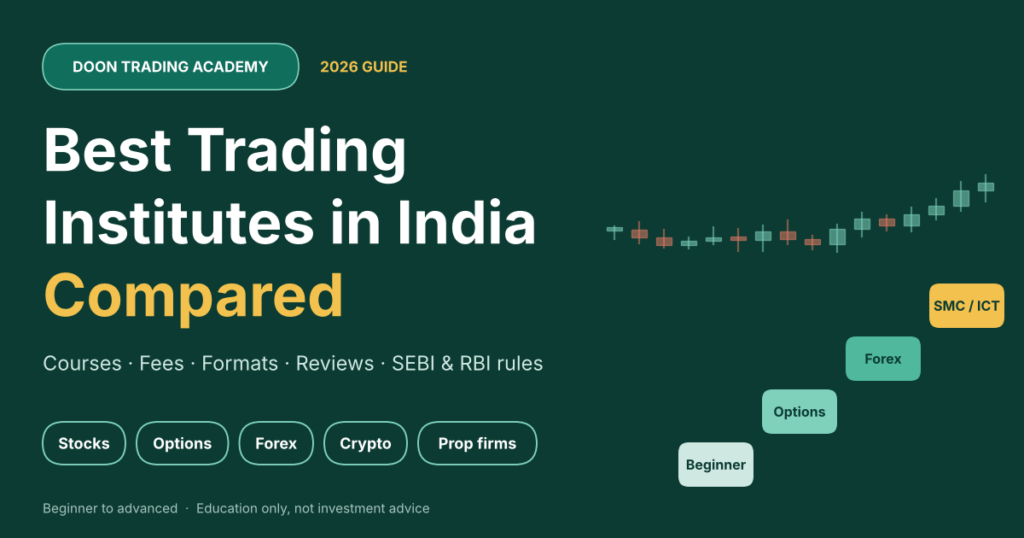
Best Trading Institutes in India (2026): Doon Trading Academy vs Stock Market, Forex, Crypto & Prop-Firm Education Providers
The right trading institute is the one whose course matches your market (stocks, options, forex, crypto or funded trading), your current level and your budget, and which teaches...

NISM vs Institute Certificates: What Each Signifies
Choosing between a NISM certificate and a certificate from a private institute (or deciding to take both) is a common dilemma for anyone entering finance, broking, mutual funds,...
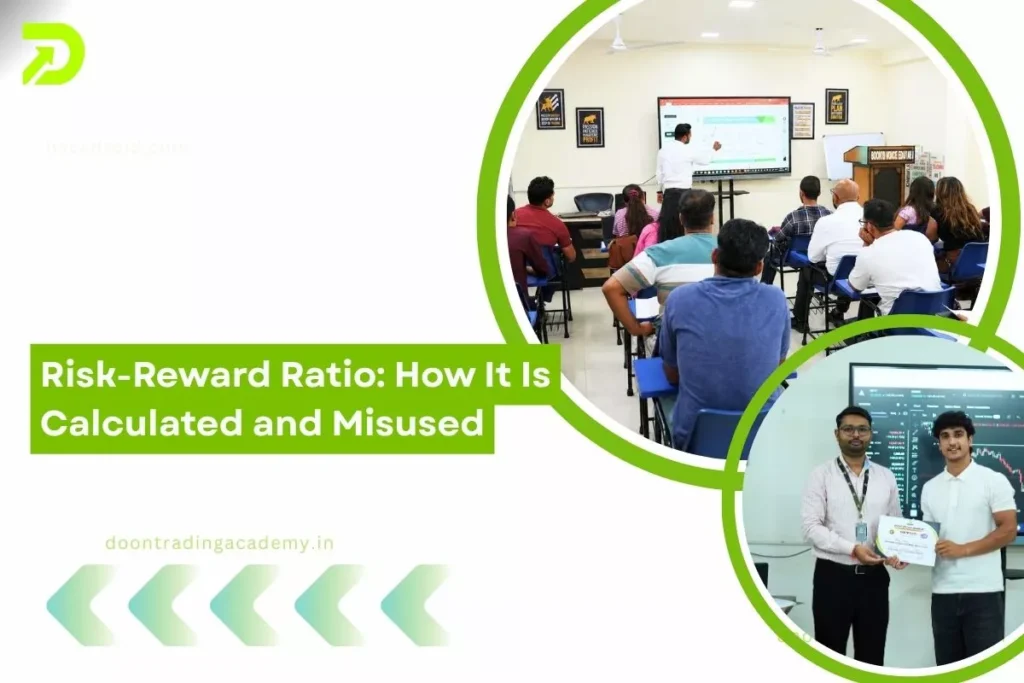
Career Paths in Indian Financial Markets: Scope, Roles & Salaries
The Indian financial markets offer a wide range of career paths — from active roles on the trading floor to research, risk management, compliance, technology and client-facing wealth...
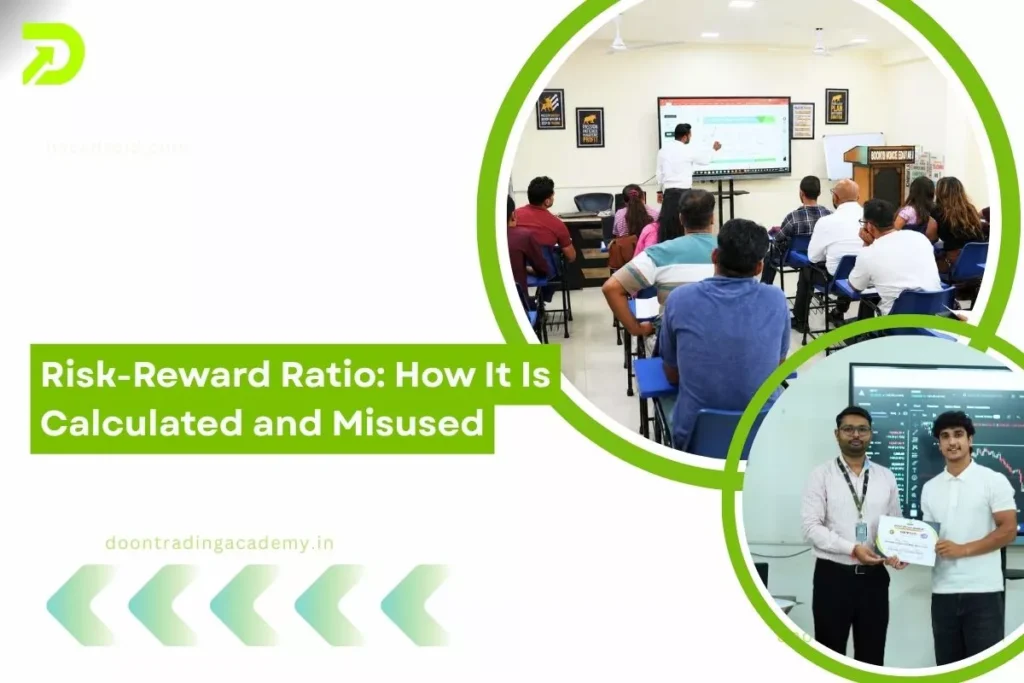
Risk-Reward Ratio: How It Is Calculated and Misused
The risk-reward ratio (RRR) is one of the simplest metrics traders use to compare potential profit against potential loss before entering a trade. Despite its simplicity, the ratio...

How to Prepare for the NISM Series VIII (Equity Derivatives) Exam
The NISM Series VIII (Equity Derivatives) certification tests foundational and practical knowledge about trading, clearing, settlement, and regulation of equity derivatives in India. Whether you need this certification...
NISM Certifications Explained: Which One and Why
NISM (National Institute of Securities Markets) certifications are the most recognised regulatory and professional credentials for many roles in India’s financial markets. This guide explains what NISM certifications...
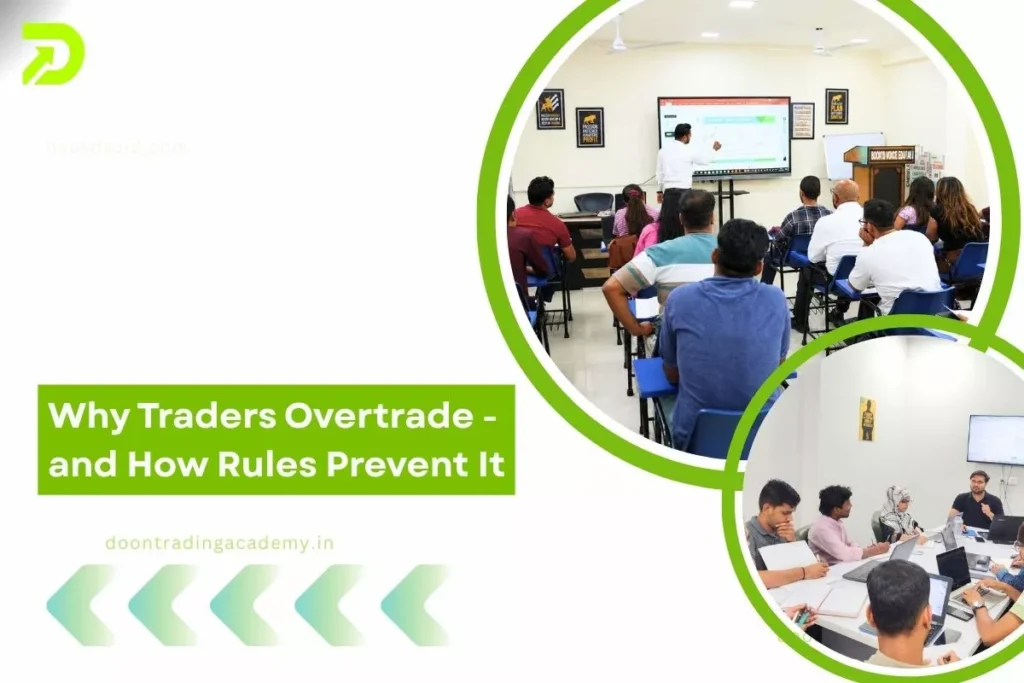
Why Traders Overtrade – and How Rules Prevent It
Overtrading—taking too many trades, trading without conviction, or increasing size after a loss—is one of the most common reasons traders lose money or experience inconsistent results. This article...
What is Revenge Trading? Causes and How to Avoid It
Revenge trading is the impulse to take new, often larger or riskier trades immediately after a losing position, with the goal of “getting even.” It is driven by...

Capital Preservation & Drawdown: Practical Rules & Metrics
Drawdown and capital preservation are closely linked concepts every investor and trader must master. Drawdown measures how much capital falls from a peak to a trough; capital preservation...

Trading Psychology 101: Why You Need Discipline, Not Predictions
Successful trading is rarely about knowing what will happen next. Markets are probabilistic, noisy, and often irrational. What separates consistent traders from inconsistent ones is not perfect foresight...