
Fibonacci retracement levels are among the most widely discussed tools in technical trading circles. While some traders see them as near-magical reversal predictors, others regard them as overhyped and barely more accurate than randomness. In my experience, understanding the true power and pitfalls of Fibonacci retracement–by blending mathematical principles, psychological insights, and empirical results–makes all the difference between using these levels skillfully versus chasing illusions. This guide explores how Fibonacci retracement levels predict price reversals within a mathematical trading approach, separating fact from fiction based on research, forum wisdom, and real strategies that work in the marketplace.
Quick Summary
- Fibonacci retracement levels are ratios derived from the famous Fibonacci sequence, widely used to identify potential price reversal zones.
- Statistical testing shows Fibonacci levels alone are only marginally more effective than chance for predicting exact turning points.
- The predictive power of Fibonacci largely emerges from mass trader psychology and clustering of buy/sell orders at key levels, creating self-fulfilling reactions.
- Fibonacci retracement works best as a confirmation tool when combined with multiple technical indicators—especially on higher timeframes.
- Success depends on chart timeframe, consistent anchor point selection, trend context, and disciplined risk management.
Introduction to the Fibonacci Sequence and Its Role in Trading
The Fibonacci sequence traces back to medieval Italy but echoes throughout nature, mathematics, and even art. Starting from 0 and 1, each number is the sum of the two before it: 0, 1, 1, 2, 3, 5, 8, and so on. This simple progression produces ratios–notably 61.8% and 38.2%–that appear everywhere from nautilus shells to galaxy spirals. When traders noticed these ratios could map onto market swings, they hypothesized that markets themselves might “obey” the same natural order. My goal in this article is to unpack whether, and how, Fibonacci retracement levels actually work to predict price reversals, and to outline how a disciplined, mathematics-based approach can turn this ancient pattern into a useful trading tool.
Understanding Fibonacci Retracement Levels
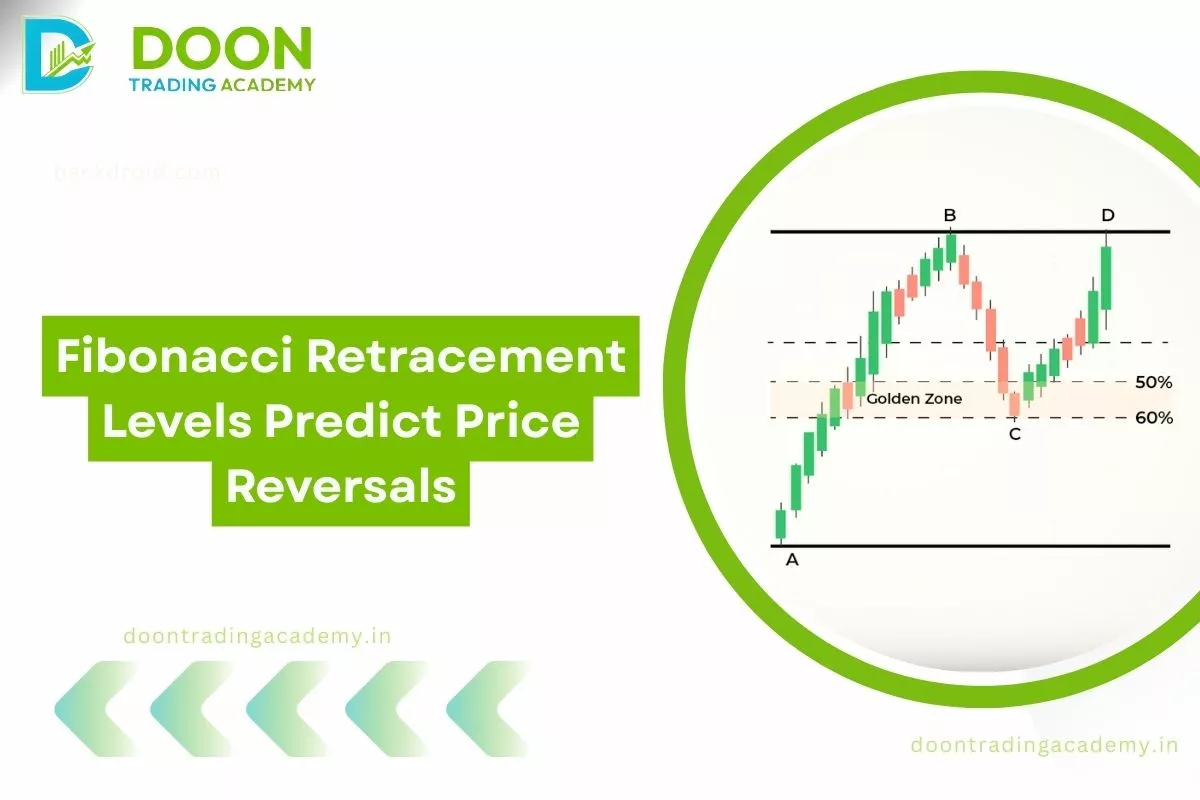
Fibonacci retracement involves plotting horizontal lines at key intervals where price might pause or reverse after a significant trend. The most common levels are 23.6%, 38.2%, 50% (a psychological midpoint, not a Fibonacci number), 61.8%, and 78.6%. Traders draw these lines by marking the previous swing high and low, then dividing the difference by these set ratios. These levels are not meant to guarantee reversals, but rather to highlight areas where many traders anticipate a reaction, making them potential support or resistance zones.
- 23.6%: Shallow retracement, often in strong trends.
- 38.2% or 50%: Typical pullbacks in well-established moves.
- 61.8%: “Golden ratio” where deeper corrections often stall.
- 78.6%: Marks very deep retracements before trend may reassert.
What makes these bands meaningful is not just the mathematics, but their role as psychological reference points for market participants.
Mathematical Basis of Fibonacci Retracement
The core Fibonacci ratios used in trading (23.6%, 38.2%, 61.8%) stem directly from the sequence’s mathematical properties. For example, dividing any Fibonacci number by the next number yields roughly 0.618 (the golden ratio). Go two places forward, and you get 0.382; three places forward, 0.236, and so on. Traders convert these decimals into percentages to identify “retracement” levels between a swing high and low. Although the 50% retracement doesn’t appear in the sequence, it was incorporated due to its psychological weight and prominence in Dow Theory.
It’s important to note: as visually compelling as these ratios are, the markets don’t “know” or “care” about mathematical beauty. The real question is whether these levels correspond with price reactions more than random chance would suggest.
Application in Technical Analysis
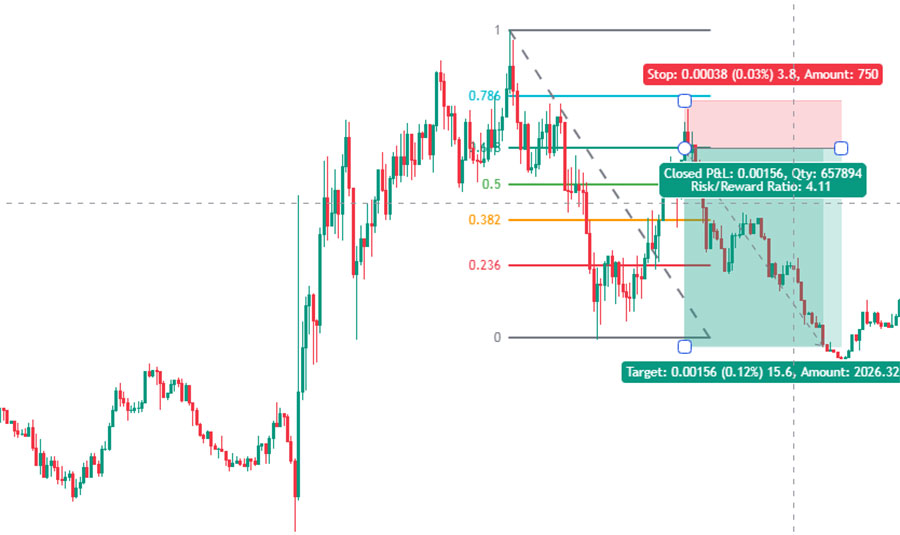
Applying Fibonacci retracement is straightforward in most charting platforms. Here’s the basic process:
- Identify a significant directional move (from swing low to swing high in an uptrend, or the reverse in a downtrend).
- Draw the Fibonacci retracement tool between these two anchor points.
- Observe horizontal lines at the calculated Fibonacci intervals.

Typically, traders look for price to retrace a portion of its trend, enter the “golden zone” (commonly the area spanning the 50%–61.8% lines), and watch for confirmation such as candlestick reversal patterns, moving averages, or RSI/MACD divergence before entering trades. For instance, if Apple ramps from $100 to $120 and then pulls back, traders will be watching the range between roughly $112.40 (38.2%) and $107.60 (61.8%) as a possible launchpad for the next move.
Predicting Price Reversals with Fibonacci Levels
Do Fibonacci retracement levels reliably predict reversals? According to in-depth backtests and academic research, the simple answer is: not consistently, if used alone. One detailed study backtested 100 trending scenarios and found, for example, that only 15% of reactions occurred near the “critical” 61.8% retracement; the 38.2% level fared even worse at 18%. In roughly one-third of cases, price cut through every level without hesitation. The takeaway is clear: “Fibonacci isn’t statistically significant so you can’t just use it to trade…use it as confirmation and bias,” as one Reddit user, @FxQuant, put it succinctly.
Yet traders, including myself, have observed that prices often stall, reverse, or consolidate at these levels more than pure randomness would dictate. Why? It’s not the inherent magic of the math, but rather the *fact that many traders* crowd orders at these obvious levels. When these clusters coincide with other technical signals (trendlines, volume spikes, RSI extremes), the probable significance increases.
- In my own use, I never act on a Fibonacci retracement if there’s no confirming price action or confluence—doing so is akin to gambling.
- Forum examples and case studies confirm this: the best reversals happen when Fibonacci aligns with support/resistance or psychological “round numbers.”
Combining Fibonacci Levels with Other Technical Indicators
The golden rule uncovered by both researchers and seasoned traders is simple: never rely on Fibonacci retracement alone. Instead, successful strategies embed Fibonacci within a broader matrix of confirmation, including:
- Major support/resistance: Historical pivots that validate a Fibonacci value.
- Moving averages: Especially when a retracement coincides with the 50-day or 200-day average.
- Volume surges: Reversal attempts with rising volume are far more credible.
- Momentum oscillators: Oversold RSI at a 61.8% retracement adds conviction.
- Price action/candlestick signals: Hammers, shooting stars, or engulfing bars at Fibonacci levels provide crucial context.
| Standalone Fibonacci | Fibonacci with Confluence |
|---|---|
| Low win rate (barely above 50% based on backtests) | Boosts accuracy to 65–72% (according to institutional studies and trader surveys) |
| Subject to whipsaws and false reversals | Filters out poor setups, increases conviction |
| High subjectivity in anchor selection | Objectivity through multiple aligning signals |
As the trading educator “StockSniper” wrote on TradingView, “The reason why Fibonacci levels are so effective is still a mystery. But one great thing about technical analysis is that we don’t need to figure out why something works in order to see it working and thus benefit from the results. Just don’t use it in isolation.”
Limitations and Risks of Fibonacci Retracement
From my experience, as well as research and real-world trader feedback, several key risks and limitations consistently emerge:
- Overcrowding/Psychological Clustering: These levels “work” best only when enough market participants believe in and act on them.
- Timeframe Sensitivity: Short-term charts (15m, 5m) are overwhelmed by noise; daily/weekly timeframes show greater validity.
- Too Many Levels: With six common retracement lines, it’s easy to cherry-pick winning cases after the fact and suffer from confirmation bias.
- Subjective Anchor Selection: There’s no universally “correct” high and low; inconsistent methodology leads to erratic outcomes.
- Market Conditions: Fibonacci retracement works poorly in choppy, non-trending, or illiquid markets.
To mitigate these risks, I always:
- Start my analysis on higher timeframes (4H, daily, weekly).
- Ensure my anchor points bracket significant, confirmed price swings.
- Use Fibonacci only in clear, established trends (never in sideways markets).
- Layer in confirmation from support/resistance, volume, and price action.
- Practice strict risk management with stops beyond adjacent Fibonacci levels or structural highs/lows.
Beyond-Common-Sense Facts About Fibonacci Retracement
- Studies prove the “100% retracement” (full return to start) is often as common as reversals at Fibonacci levels, undermining their stand-alone predictive power.
- Algorithmic trading systems explicitly program Fibonacci levels, amplifying their effect through massive order clusters.
- The cognitive ease of dividing space into golden ratios (0.618) may subconsciously guide not just trader behavior but the very placement of institutional stops/targets.
- Empirical research shows confluence of Fibonacci with multi-timeframe signals dramatically improves edge—aligning levels across daily, 4H, and 1H can raise win rates by 28–40%.
- In less liquid markets, such as obscure cryptocurrencies or penny stocks, Fibonacci’s predictive “magic” vanishes due to absence of mass order clustering.
Practical Tips for Traders
For those new to Fibonacci retracement, here’s a step-by-step process I use and recommend:
- Start with the daily or 4H chart. Identify a clear swing high and low (objectivity improves results).
- Apply the Fibonacci retracement tool using your charting platform’s built-in functions.
- Highlight the 38.2%, 50%, and 61.8% levels.
- Scan for confluence: Does a key support, moving average, or trendline align with a Fibonacci level?
- Wait for confirmation: Look for reversal candlesticks, upswings in volume, or momentum shifts near those zones—not just a touch or close at the line.
- Set stops: Place stops just beyond the next Fibonacci level, or slightly past the swing anchor, to avoid random shakeouts.
- Keep records: Journal your trades, noting whether the reversal matched a Fibonacci level and what secondary signals were present.
Common pitfalls include sloppy anchor selection (arbitrary highs/lows), chasing every bounce at a Fibonacci level, or basing trades on short-term, noisy charts.
Conclusion
In my hands-on experience, Fibonacci retracement levels are neither magic reversal buttons nor useless lines. I’ve learned that their true utility emerges when I view them as psychological magnets for clustered market participation—tools that can help predict reversals only when layered with confirmation from other technical and behavioral signals. Backtests reinforce that acting on Fibonacci levels alone is almost indistinguishable from flipping a coin. But by using higher timeframes, consistent anchor points, and always looking for confluence (support/resistance, volume, price action), I’ve transformed Fibonacci analysis from a source of frustration into a valuable edge in my toolkit.
Let’s recap the process for effective Fibonacci deployment:
- Begin by identifying major swings on higher timeframe charts.
- Apply the Fibonacci retracement tool—objectively, from clear high to clear low.
- Highlight “Golden Zone” levels (38.2%–61.8%) and scan for confluence with structural supports and secondary indicators.
- Wait for confirmation (candlestick reversal, volume, momentum).
- Set risk-managed stop-losses beyond the next retracement line or swing pivot.
- Continue to record, review, and adjust based on real performance.
Did Fibonacci levels help you catch a market reversal or do you have a favorite strategy for combining them with other tools? I’d love to hear your experiences and questions—please share your thoughts below and let’s learn from each other.