


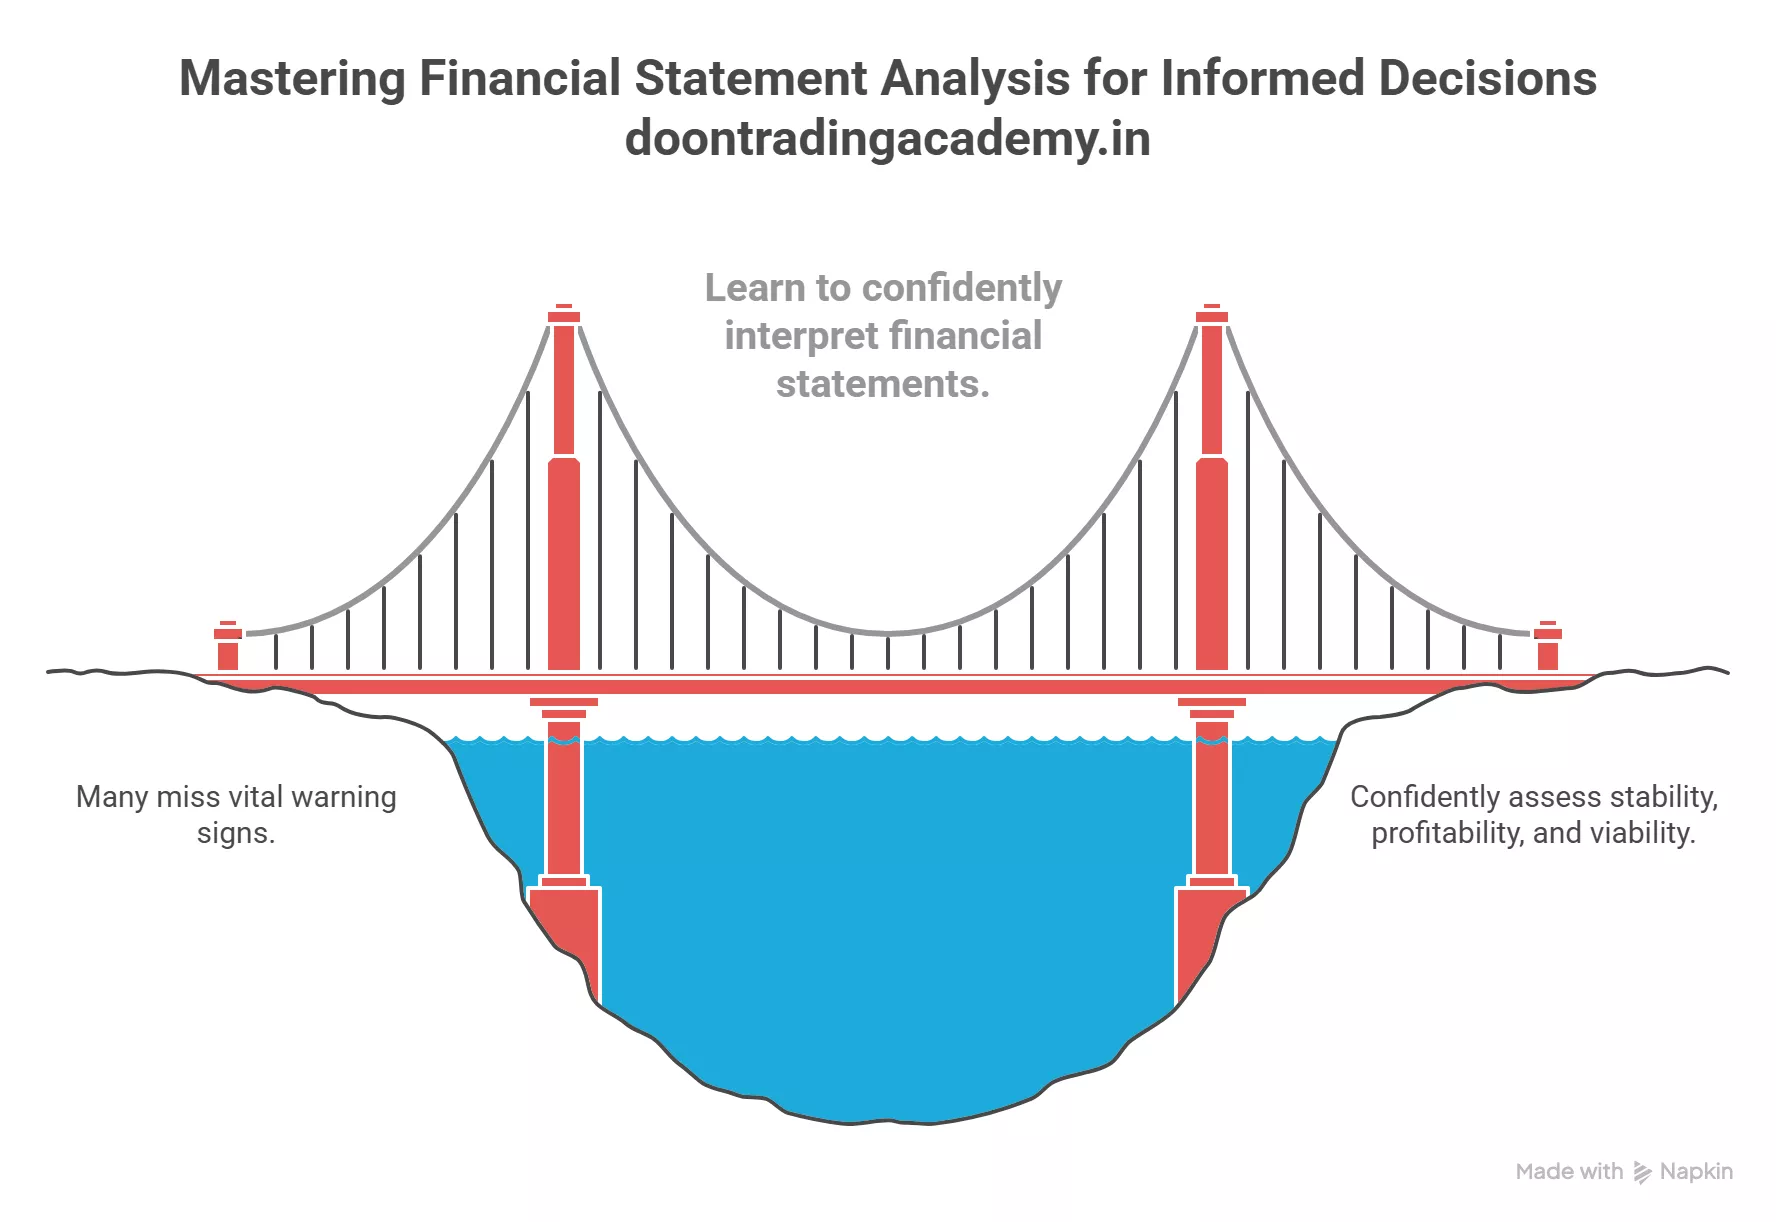
Financial statement analysis is the backbone of informed decision-making in business, investing, and credit evaluation. Over years of examining financials—from Fortune 500 companies to small startups—I’ve seen firsthand how understanding the balance sheet, profit and loss statement (P&L), and cash flow statement opens a window into how a company really operates. Yet, many people find themselves overwhelmed or miss vital warning signs simply by skimming surface numbers. In this guide, I’ll equip you with practical tools and expert-backed perspectives to confidently interpret each statement and make well-rounded assessments. Whether you’re a beginner or looking to deepen your analysis, let’s break down the essentials and learn how these documents interconnect.
Quick summary
- The balance sheet offers a snapshot of a company’s financial position at a specific point in time.
- The profit and loss statement shows how much revenue a company brings in and what costs were incurred to earn that income over a set period.
- The cash flow statement reveals actual cash moving in and out, bridging the gap between “book profits” and real liquidity.
- Sound analysis requires cross-referencing all three statements, applying key ratios, and understanding business context.
- Red flags—like growing discrepancies between net income and cash flow or sudden changes in accounting policy—demand further scrutiny.
What Is Financial Statement Analysis and Why Does It Matter?

Financial statement analysis is the process of examining a company’s financial statements to assess its stability, profitability, liquidity, and long-term viability. These statements—namely the balance sheet, income statement, and cash flow statement—aren’t just boxes to tick for compliance; they hold the critical insights investors, lenders, and business owners need to make strategic calls. As one Reddit user put it, “If you read all three and make sure they make sense with each other, you’ll rarely be blindsided as an investor.” (u/badclouddream) Analysis brings together accounting knowledge, business context, and raw numbers, revealing trends and red flags hidden beneath the surface.
The Balance Sheet: Reading a Company’s Financial Snapshot
Purpose and Structure
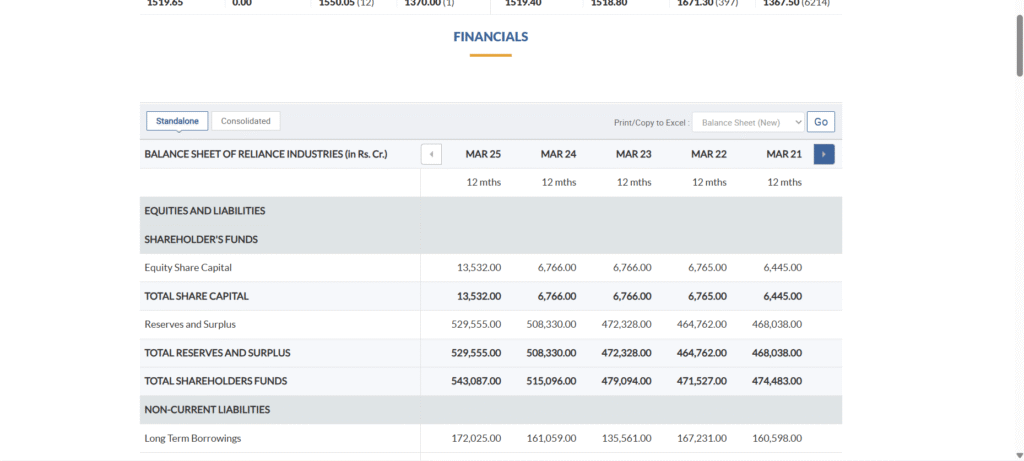
The balance sheet provides a snapshot of a company’s financial position by listing its assets, liabilities, and equity at a specific date—typically quarter-end or year-end. Organized under the equation Assets = Liabilities + Equity, it discloses both what a business owns (assets) and owes (liabilities), plus what’s left for the owners (equity).
Key Components Explained
Assets are split into current (cash, inventory, receivables—things expected to convert to cash within a year) and non-current assets (property, equipment, long-term investments).
Liabilities include what the business owes—like short-term obligations due within a year (accounts payable, short-term loans), and long-term debts (bonds, mortgages).
Equity is the residual value for shareholders after liabilities, covering both invested capital and retained earnings.
| Assets | Liabilities & Equity |
|---|---|
| Cash & equivalentsReceivablesInventoryProperty, plant & equipmentIntangibles (e.g. patents) | Accounts payableShort-term debtLong-term debtAccrued expensesShareholders’ equityRetained earnings |
Important Metrics to Assess Balance Sheet Health
- Current Ratio (Current Assets / Current Liabilities): Reveals short-term liquidity and a company’s ability to pay near-term bills. A ratio greater than 1.0 is usually considered healthy, but norms vary by industry.
- Debt-to-Equity Ratio: Indicates leverage. High values can mean increased risk but may be normal in capital-intensive sectors.
- Working Capital (Current Assets – Current Liabilities): Shows operational financial cushion. Negative working capital could signal impending cash flow problems.
I’ve found it’s crucial to scrutinize the notes accompanying balance sheets—they often explain accounting policy tweaks or highlight contingent liabilities. For example, one manager in a small business subreddit mused, “I missed that our new software lease would be reclassified as a liability, and that threw off our current ratio in a way I didn’t expect.” (u/cfoinsb) Changes like these illustrate why numbers alone rarely tell the full story.
Profit and Loss Statement (P&L): Measuring Performance Over Time
Purpose and Structure
The P&L tells the story of how much money a company earned (revenue) and what it spent (expenses) over a period, typically a quarter or year. It starts at the top with revenue and descends stepwise through cost of goods sold (COGS), operating expenses, and other items, down to net income.
Main Elements
- Revenue: Money brought in from primary business activities. Some firms break this into categories (product, service lines, etc.).
- COGS: Direct costs tied to producing goods or services sold.
- Gross Profit: Revenue minus COGS. Indicates, as one analyst posted on Reddit, “how much meat is left on the bone after paying for stuff you just sold.” (u/financeanalytica)
- Operating Expenses: Overheads (admin, sales, research), not tied directly to production.
- Operating Income: Also known as EBIT, this reflects the profit from core operations.
- Net Income: The “bottom line,” showing what’s left after all expenses, interest, and taxes.
P&L Ratios That Matter
- Gross Profit Margin (Gross Profit / Revenue): Measures efficiency of production or service de.ry.
- Operating Margin (Operating Income / Revenue): Assesses profitability from routine business.
- Net Profit Margin (Net Income / Revenue): Reveals true profitability after all costs.
In my experience, new investors often conflate net income and operating cash generation. The two can diverge dramatically, especially if customers are slow to pay or a business books big one-off gains. As the YouTube educator “Accounting Stuff” explains, “Profit is not always cash. Revenue can be booked when goods are shipped, even if customers haven’t paid yet. Cash flow might tell a different story.”
Cash Flow Statement: Tracking Real Money Movement
Purpose and Structure
The cash flow statement details changes in a company’s cash position, divided into three main sections: operating, investing, and financing activities. This is where you see whether profits on paper translate into actual money in the bank, and it’s often the first place serious analysts look for warning signs.
| Section | What It Shows |
|---|---|
| Operating Cash Flows | Profit from core business plus/minus changes in working capital |
| Investing Activities | Spent on or received from major long-term asset purchases/sales |
| Financing Activities | Money raised by issuing stock or taking loans, or paid to owners/lenders |
Why Is Cash Flow Key?
Companies can easily post net profits while bleeding cash, especially when revenue growth is fueled by unsustainable borrowing or by stretching out payment terms with suppliers and customers. As one experienced CFO commented in an online forum, “I tell my team: Net income is an opinion. Cash flow is a fact.” (u/trialbalancepro)
Key Metrics to Watch
- Operating Cash Flow (OCF): Should be positive and ideally stable or growing.
- Free Cash Flow (FCF): OCF minus capital expenditures. Indicates money available for debt repayment, dividends, or reinvestment.
- Cash Conversion Cycle: Measures how quickly a company turns investments in inventory and receivables into cash from sales.
Practically, I always reconcile net income from the P&L with cash from operating activities here, scanning for large discrepancies driven by non-cash items or working capital swings. On Reddit, someone asked, “How can a company report $1M in profit but have negative cash flow?” The top-voted answer broke it down: that profit can be locked up in receivables, uncollected from buyers. Real-life cash is king.
Interconnectivity of the Three Major Statements
While each financial statement stands alone, they’re deeply intertwined. Net income from the P&L feeds into the equity section of the balance sheet as retained earnings. Simultaneously, it is the starting point for the operating activities section in the cash flow statement. Changes in working capital (receivables, payables, inventory) reflected on the balance sheet are echoed in the cash flow’s operating section. For example, a jump in inventory without a corresponding rise in sales (shown on the income statement) may bog down cash flow and inflate risk.
It’s by cross-referencing these statements that subtle stories emerge: Maybe sales (on the P&L) are rising, but only because receivables (on the balance sheet) are surging—which explains the shortfall in cash generated (on the cash flow statement).
Advanced analysts use this interplay to detect manipulation or hidden problems. In fact, the forensic accounting community often reminds us, “If you find that cash flow is out of sync with net income for more than a quarter or two, start asking hard questions.” (u/forensicfin)
Advanced Analysis: Beyond Simple Ratios
Financial Ratios: Context and Benchmarks
Ratios like current, quick, and debt-to-equity allow for quick comparisons within an industry, but benchmarks matter. High inventory turnover may signal efficiency for a grocer but trouble for a jeweler. Seasoned pros suggest checking industry standards before drawing conclusions.
DuPont analysis—decomposing return on equity into profit margin, asset turnover, and leverage—offers deeper clarity. For example, two companies may both post a 15% ROE, but one achieves this by taking on excessive debt (dangerous), while the other achieves it through strong margins and operational discipline (safer).
Horizontal and Vertical Analysis: Revealing Trends and Proportions
Horizontal analysis compares accounts over time to spot trends (like falling margins, rising debt). Vertical analysis reveals the proportion of each item relative to a base figure (such as expenses as a fraction of revenue). This dual approach uncovers outliers, such as operating expenses ballooning faster than revenue—a warning sign for efficiency or scaling issues.
Beyond-Common-Sense Insights
- Depreciation can make cash flows stronger than net profit. A company with heavy fixed assets might show low net income after big depreciation charges but still generate robust cash flows, thanks to depreciation being non-cash.
- High “Other Income” deserves skepticism. Sudden surges in non-core income can mask weakness in operational performance—a red flag noted repeatedly on r/investing.
- Inventory spikes right before year-end can mask sluggish sales. Firms sometimes “push” unsold goods into inventory, inflating asset totals without generating sales.
- Debt maturities matter as much as total debt. Two companies with the same total borrowings can have wildly different risk profiles if one faces a massive loan coming due next quarter.
- Normalized (recurring) earnings are more predictive than reported net income. Major one-off gains or losses should be set aside for trend analysis—a point stressed by analysts on forums and in YouTube explainers alike.
Common Pitfalls and Troubleshooting in Financial Statement Analysis
From my own reviews and helping others on forums like r/accounting and Stack Exchange, I’ve seen common mistakes trip up even diligent readers:
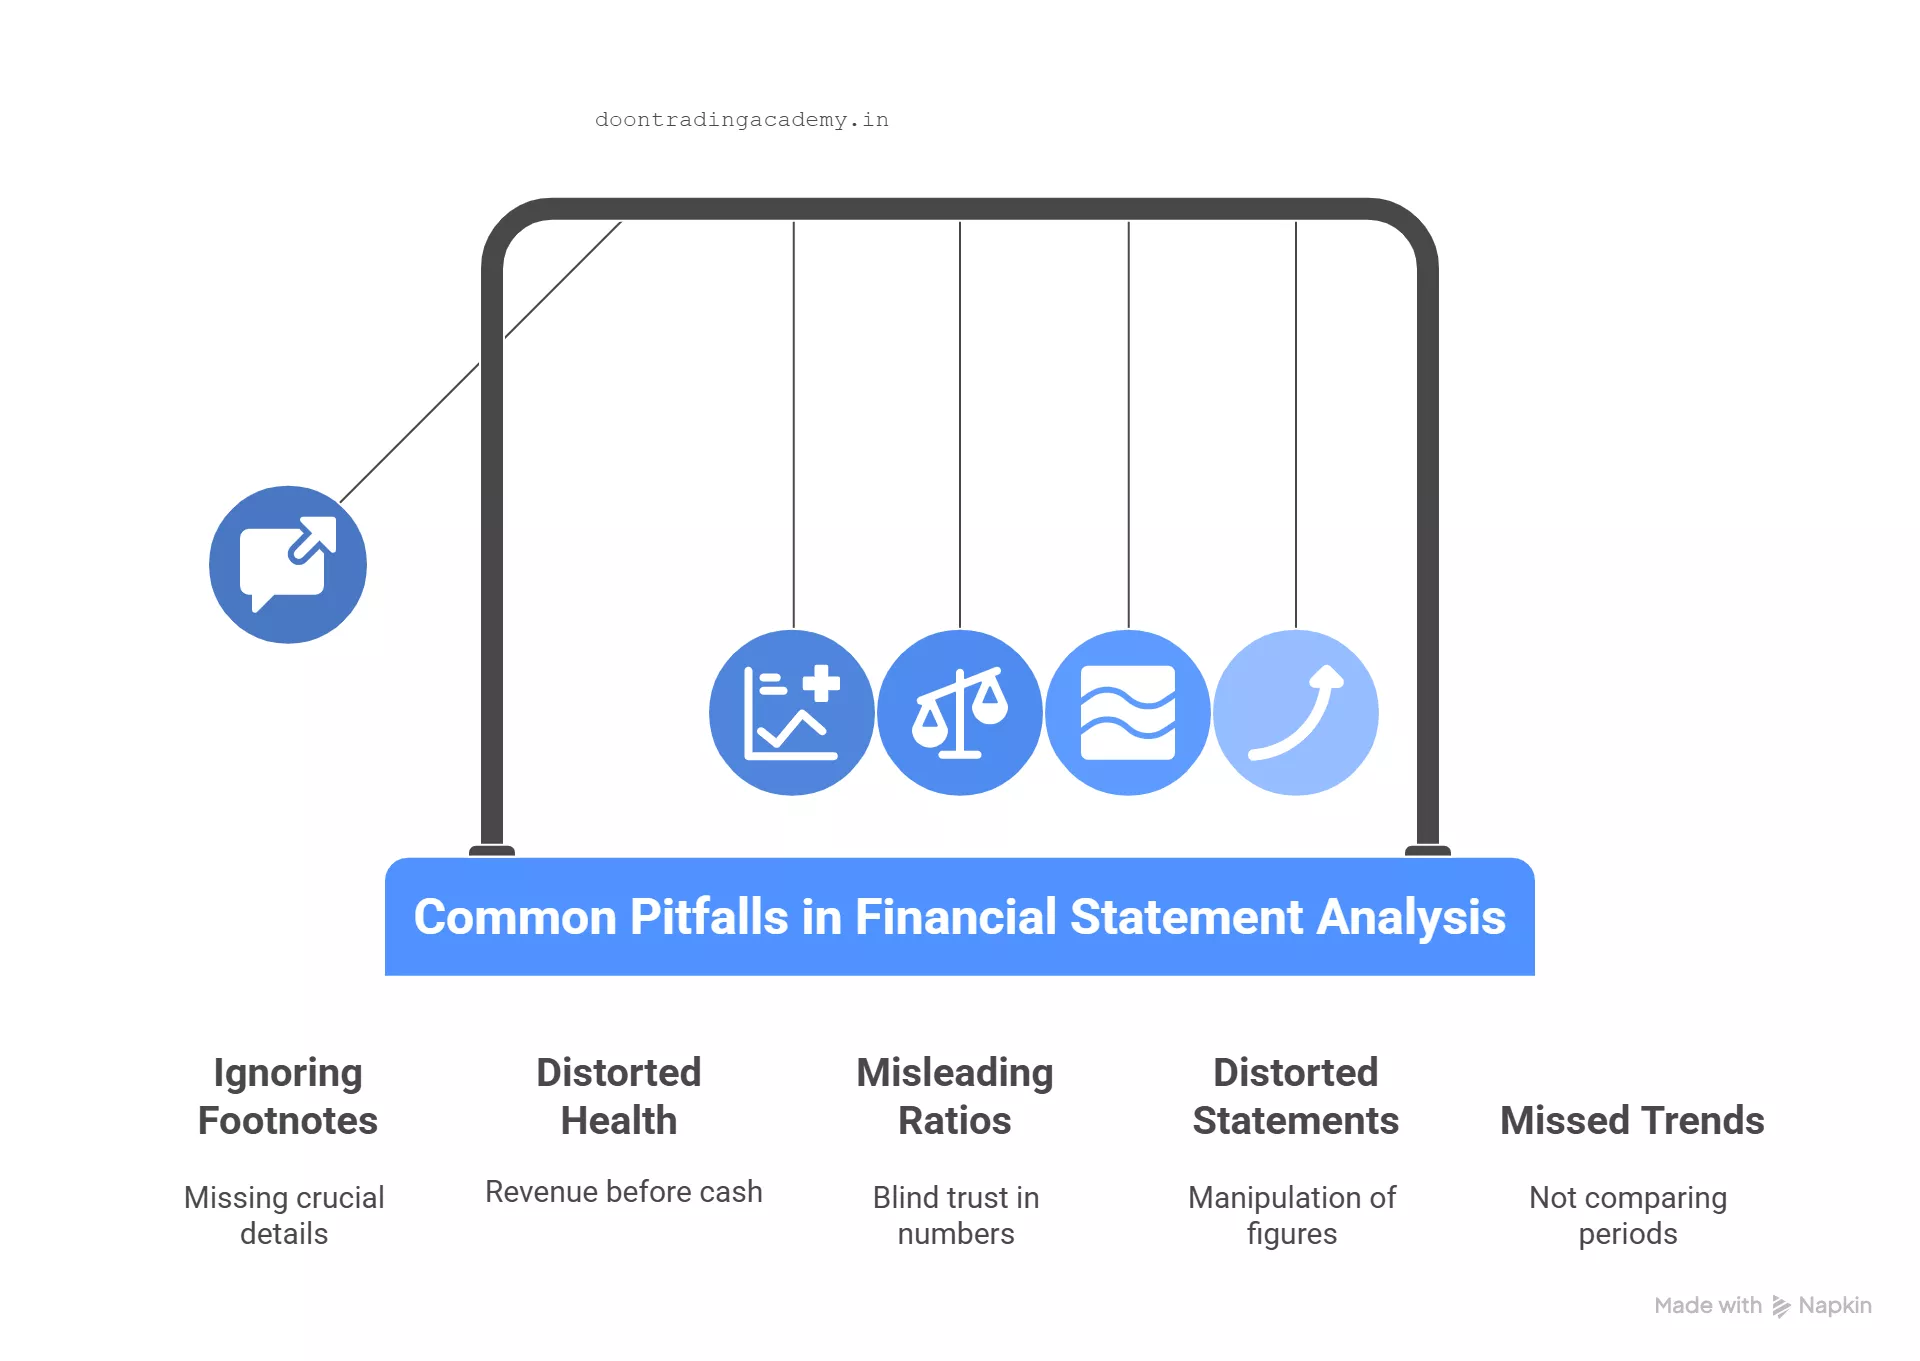
- Ignoring footnotes: These often detail off-balance-sheet items, pending lawsuits, or accounting policy changes that move the numbers.
- Overlooking timing mismatches: Revenue may be booked before cash is collected, distorting the health signaled by net income.
- Blindly trusting ratios: Without considering business model and industry, ratios mislead. A 2.0 current ratio is healthy for some, excessive for others.
- Failing to spot manipulation: Sudden switches in depreciation methods, big year-end transactions, or undisclosed related-party deals can distort all three statements.
- Not comparing across periods: Trend analysis is vital. As I tell my mentees, “One good year can be luck (or accounting magic)—three good years show execution.”
Use of Tools and Technology for Better Analysis
Today’s analysts use robust spreadsheet models, visualization tools like Tableau, and services such as QuickBooks or Xero for internal reviews. Public company filings are increasingly “machine readable,” letting users plot trend lines or ratios instantly. As one data analyst wrote on a forum, “Why compare five columns by hand when Power BI can flag outliers in seconds?” (u/trendhunterdata)
Still, no algorithm replaces the intuition honed by reading hundreds of statements and understanding business nuance behind the numbers.
References and Additional Resources
- Investopedia’s Financial Statement Analysis Guide
- r/investing Subreddit: Search for “financial statement analysis” discussion
- Accounting Stuff – YouTube Channel
- CFA Institute: Practical Analysis Case Studies
- edX: Financial Accounting Courses
- SEC EDGAR: Public Company Filings and Statements
Conclusion
Through my own journey—and seeing countless real-world examples—I’ve learned that mastering the reading of financial statements means treating them not as isolated checklists, but as interconnected chapters of a business’s story. I always start by scanning the balance sheet for liquidity and leverage, dive into the P&L for profitability trends, and reconcile everything with actual cash flows. Then, I look for consistency over time and between statements, scrutinizing footnotes and context for anything unusual. It pays to compare results against industry benchmarks and not to ignore those “gut check” moments when something just feels off.
As a step-by-step recap, here’s my streamlined process:
- Begin with the balance sheet to understand assets, liabilities, and funding structure.
- Map the flow of money by reviewing the P&L for revenue, margins, and expenses.
- Reconcile reported profits with cash flows to ensure healthy liquidity.
- Apply key ratios, vertical/horizontal analysis, and DuPont breakdown for deeper insight.
- Closely read the notes, compare statements over time, and stay alert for red flags.
The more you analyze, the quicker you’ll spot patterns and anomalies. If you have questions, want to share your favorite analysis tip, or disagree with any point, please leave a comment below—I’m always interested in how others read between the lines of financial statements and make smarter decisions.