

Support and resistance levels are core concepts in technical trading, shaping how I and countless others approach price movement. At their most basic, these zones represent the invisible walls in financial markets—places where prices bounce, stall, or reverse. Their importance in making trading decisions can’t be overstated: understanding where price is likely to find a floor or ceiling can mean the difference between profit and loss.
This guide is designed to demystify price zone identification and show you how support and resistance guide trading decisions. I’ll walk you through not just “where” these levels show up, but “why,” explaining proven methods for finding them, confirming their validity, and using them in real trades. Along the way, you’ll learn why many retail traders fail despite recognizing the same levels, and how professional and institutional approaches can dramatically improve win rates.
Quick summary
- Support and resistance zones shape almost every price move in the markets and are foundational to technical trading decisions.
- Robust identification methods combine multiple market factors—including swing highs/lows, candlestick patterns, and volume—to spot actionable levels.
- Institutional traders and “smart money” leave footprints at these zones, making their activity crucial for reliable zone identification.
- Using confluence and multi-timeframe analysis boosts win rates, often separating consistently profitable traders from the rest.
- Success relies on systematic confirmation—not intuition—and demands disciplined risk and trade management around these zones.
Understanding Support and Resistance Levels
Support and resistance are fundamental pillars of technical analysis. A support level is a price point where downward movement is halted due to increased demand, while resistance marks where upward movement stalls as sellers take control.
Psychologically, these levels form because of repeated behaviors—traders remember past reversal points, and institutions manage large orders over several attempts, causing price to react consistently at specific areas. As a result, these levels gain power through repeated “touches” on charts. When price repeatedly bounces off the same region, it demonstrates consensus among traders, both retail and institutional.
The principle of polarity, or role reversal, adds significance: once resistance is decisively broken, it often becomes support on a retest (and vice versa). This reflects a shift in market sentiment—what once capped price now becomes a launching point for new moves.

The Role of Support and Resistance in Trading
Support and resistance levels guide nearly every trading decision. They create the framework for:
- Market Entries: Buying at or just above support and selling at or just below resistance maximizes upside and controls risk.
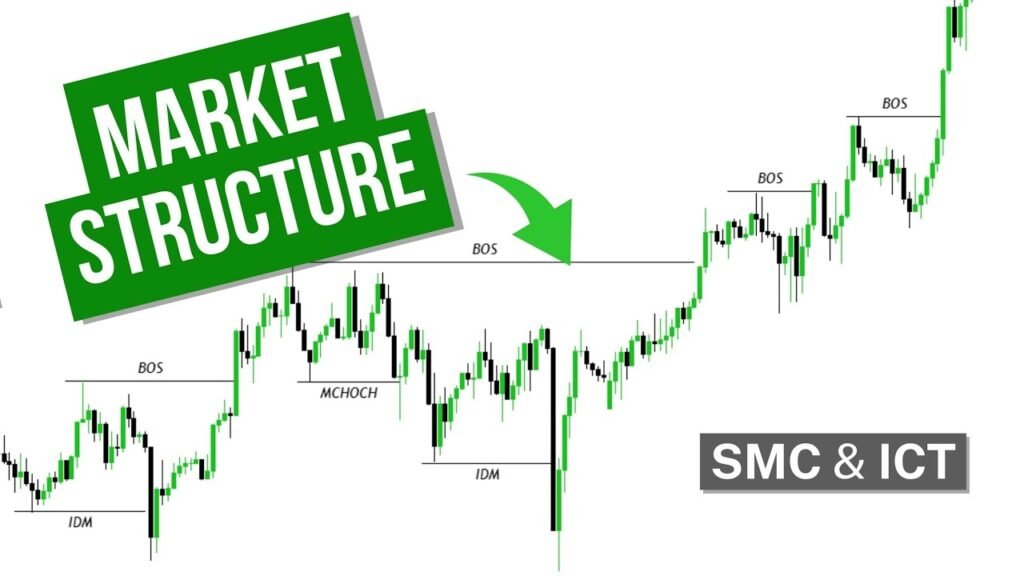
- Trend and Reversal Identification: Trends are validated as price bounces off support (uptrends) or resistance (downtrends); reversals are confirmed by breaks and retests.
- Risk Management: Setting stops and targets around these levels incorporates proven logic, anchored in crowd and institutional behavior.
According to seasoned traders, “You should always aim to achieve the most touches possible on either side of the level,” ensuring you’re focusing on the areas where actual transaction volume and market psychology converge.
Methods for Identifying Support and Resistance Levels
Identifying these levels requires a blend of observation, methodology, and discipline. Here are the primary, research-backed approaches:
Horizontal Support and Resistance
These are straightforward, horizontal lines drawn across price highs (resistance) and lows (support) where price has reversed multiple times. Unlike random “guessing,” I’ve found that focusing on zones where the market spent significant time and experienced multiple reversals yields the most reliable areas.
Tip: Use daily or weekly charts to spot the major levels, as these are respected by both institutions and retail traders.
Trendlines
Trendlines form diagonal zones, connecting successive higher lows in uptrends (support) or lower highs in downtrends (resistance). They add a dynamic, evolving element to your analysis. Professional traders often move their lines up or down slightly to maximize touches and ensure the trendline encompasses consensus turns.
Moving Averages as Dynamic S&R
Moving averages, such as the 50-day or 200-day, act as “soft” support and resistance that adjust with price over time. For example, many traders use a 20-period EMA for short-term zones and a 200-period SMA for long-term context. These levels become particularly powerful when price pulls back to the average and reacts there, especially when combined with horizontal or trendline S&R.
Fibonacci Retracement Levels
Fibonacci retracement tools identify potential reversal zones using ratios (like 23.6%, 38.2%, 50%, 61.8%) derived from significant price swings. These are not arbitrary—market structure and institutional algorithms often “hunt” these levels, making them widely respected. Retracements that line up with existing price structure and show reaction via candlesticks or volume become especially powerful.
Price Action and Candlestick Patterns
Raw price action—formations like pin bars, engulfing candles, and doji candles—often signal strong support or resistance. For example, a bullish pin bar piercing support with a long lower tail and closing near the session high signals rejection of lower prices, as one trader noted, “When I see a three-touch pin bar at support with volume pickup, I know the big players are in.” Engulfing and fakey patterns provide additional confirmation, especially on fresh, previously untested zones.
Techniques for Confirming Support and Resistance Levels
The pros don’t stop at identification; they confirm. Here’s how:
- Volume Analysis: Zones validated by high transaction volume are more statistically robust. As one Reddit user, u/tradeveteran, put it: “When you see price bounce at support with a spike in volume, you’re watching true market players step in.”
- Back-testing and Historical Analysis: I always review how price behaved at a zone over the last six months. Fresh untested zones have proven stronger reactions, as repeated touches “drain” the buying or selling pressure (liquidity).
- Secondary Technical Indicators: Tools like RSI or MACD offer additional context—e.g., oversold RSI reinforcing support, or divergence at a resistance break strengthens a reversal case.
Common Mistakes and Tips for Effective Use
From my own learning curve (and hard-earned losses), I recognize common pitfalls:
- Trading Every Touch Blindly: Entering on every visit to a level ignores the likelihood that repeated tests weaken the zone. “Every time price comes back… it’s draining it,” writes one pro. Always wait for confirmation—visible rejection, rising volume, and ideally, confluence with other indicators.
- Overloading Your Chart: Too many lines breed indecision. Only mark levels that are obvious and confirmed with multiple touches.
- Ignoring Market Context: Support and resistance are not foolproof; a level that held for months can fail suddenly if news or higher timeframe structure shifts.
- Placing Stops Directly On Levels: Institutions know where retail stops cluster. “Stop hunts” are common; place your stop 0.5–1 ATR beyond the zone, not right at it.
- Risking Too Much: No level is guaranteed—never exceed 1–2% risk per trade, even on “perfect” setups.
Pro Tip: Use checklists for confluence—require a price action signal, volume confirmation, alignment with higher timeframe, and S&R before entry.
Real-World Examples and Case Studies
To see how all this works in practice, let’s look at several trade setups:
- The Multi-Touch Resistance Short: After three clear rejections at resistance (daily chart), a fourth approach with an engulfing candle and high volume convinced me to take a short. I set my stop 0.8 ATR above resistance to avoid a stop hunt. The trade briefly wicked against me but followed through as institutions defended the level, yielding a high-probability win.
- Break and Retest: On another occasion, price broke above resistance with a sharp move and high volume. Rather than buying immediately, I waited for a pullback to the old resistance (new support). A pin bar rejected the level with a fresh spike in volume—a textbook break-and-retest setup. The position then moved quickly toward the next resistance level.
- Order Blocks and Liquidity Zones: As Smart Money Concepts gained traction, I started marking out fresh order blocks (the last candle pre-impulse). When price revisited these zones with a sharp rejection and volume, trades had a noticeably higher success rate, echoing institutional activity and liquidity grabs.
These methods, when followed with discipline and not intuition, turned what once felt like “random” results into systematic, repeatable success.
Beyond-Common-Sense Insights: Five Advanced Facts About Price Zone Identification
- Institutional Footprints Matter Most: True support and resistance zones reflect where large banks execute orders and leave lingering liquidity, not just where price reversed for retail traders. That’s why understanding institutional concepts like order blocks and fair value gaps elevates your edge.
- Volume Profile and Money Zone Analysis Outperform Simple Lines: Mapping out high value areas (from volume-by-price data) identifies where 70% of transactions occurred, often predicting future reactions better than traditional S&R lines alone.
- Repeated Touches Weaken, Not Strengthen, Levels: Contrary to intuition, each additional test of a zone reduces its reliability; professional traders significantly prefer “fresh” untouched levels for their best setups.
- Multi-Timeframe Confluence Compounds Probability: When the same zone is visible and respected across Weekly, Daily, and 1H charts, it dramatically increases the odds of a successful reaction, as traders of all sizes are watching and acting at the same spot.
- Strong Breakouts Require Decisive Closes—Not Just Breaches: High-probability breakouts move well beyond a level and confirm on increased volume and multiple closes. “A weak breakout will barely push through … strong breakouts gap and close far beyond,” notes one pro, helping to filter out common false signals.
Comparative Table: Key Zone Identification Methods
| Method | Best Use Case |
|---|---|
| Horizontal S&R | Major reversal points; most effective on daily/weekly charts |
| Trendlines | Following accelerating or decelerating trends; swing trading |
| Moving Averages | Dynamic trend support, filtering with other zones |
| Fibonacci Retracements | Spotting potential pullback or continuation levels |
| Order Blocks (SMC) | Pinpointing institutional entry/exit zones; high volatility moves |
Conclusion
Looking back over my own journey and studying countless successful traders, one thing stands crystal clear: there’s no magic in support and resistance levels alone. Their true power comes when I use disciplined, systematic processes—combining strong zone selection, waiting for clean price action confirmation, layering in volume and higher timeframe alignment, and relentlessly managing risk.
Step by step, the process I follow—and recommend for anyone seeking consistency—is:
- Mark only the most obvious support and resistance zones—look for multiple, recent touches visible on major timeframes.
- Layer in order blocks, fair value gaps, and volume-by-price data to spot where institutions have left footprints.
- Always require confirmation signals: candlestick reversals, volume spikes, and multi-timeframe alignment.
- Never place stops at the “obvious” level; buffer them using 0.5–1.0 ATR to avoid institutional stop hunts.
- Set position sizes based on your stop distance to maintain stable risk—never exceed 1–2% per trade.
- Exit at the next logical support or resistance—don’t get greedy, and scale out if possible.
- Document setups, review recurring patterns, and refine your personal checklist over dozens or hundreds of trades.
If you want your trading to move beyond randomness, focus less on finding “perfect” lines and more on building a robust, repeatable workflow around price zones. I invite you to share your own experiences, questions, or ‘aha’ moments in the comments below—let’s keep refining our edge, together.