
In my trading journey, I’ve learned that understanding price movements without analyzing the volume behind them is like trying to navigate with half a map. Volume analysis not only helps confirm whether a price move is genuine but also offers vital clues about the actions of powerful market participants, commonly referred to as “smart money.” By deciphering volume’s patterns and integrating smart money flow detection techniques, traders like us can make more informed, confident decisions—even in volatile markets.
Quick summary
- Volume analysis is crucial for distinguishing real price moves from weak, unsustainable ones.
- Smart money—institutions and professionals—leave discernible footprints in volume patterns.
- Techniques like On-Balance Volume and Accumulation/Distribution are vital for detecting institutional accumulation or distribution.
- Combining multi-timeframe volume analysis and real-time sentiment tracking (e.g., Reddit) refines edge and risk management.
- Effective traders synthesize volume analysis with technical, sentiment, and order flow tools for higher-confidence trades.
Introduction to Volume Analysis and Smart Money Flow
Price charts may catch your eye, but volume tells you who is actually buying and selling. Volume analysis gives life to price movements, distinguishing between minor retail pushes and serious institutional shifts. Smart money flow detection, a staple among professional traders, hinges on spotting these volume signatures—areas where big players quietly enter or exit.
Why does this matter? Because institutions can’t simply rush into positions—instead, they accumulate and distribute stock so subtly that only careful volume-based analysis will reveal their hand. Decoding these clues empowers traders to act in alignment with market forces, and not against them.
Understanding Volume Analysis
What Is Volume in Financial Markets?
Volume is the total number of shares or contracts traded for a specific asset during a set period. It’s one of the purest forms of market data—reflecting actual transactions, not just intentions or bids.
While price tracks movement, volume reveals participation. For instance, a price surge on high volume signals conviction—buyers and sellers are actively engaged. In contrast, similar price action on low volume might be empty volatility, easily reversed.
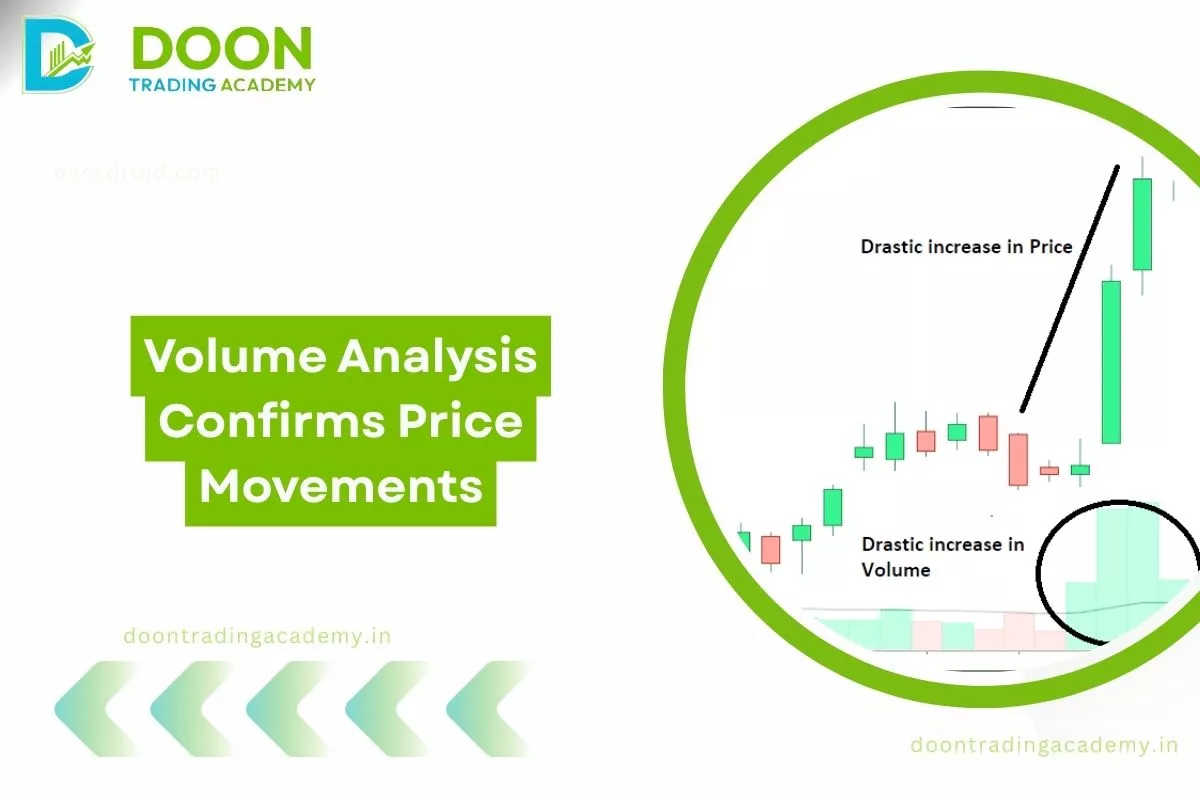
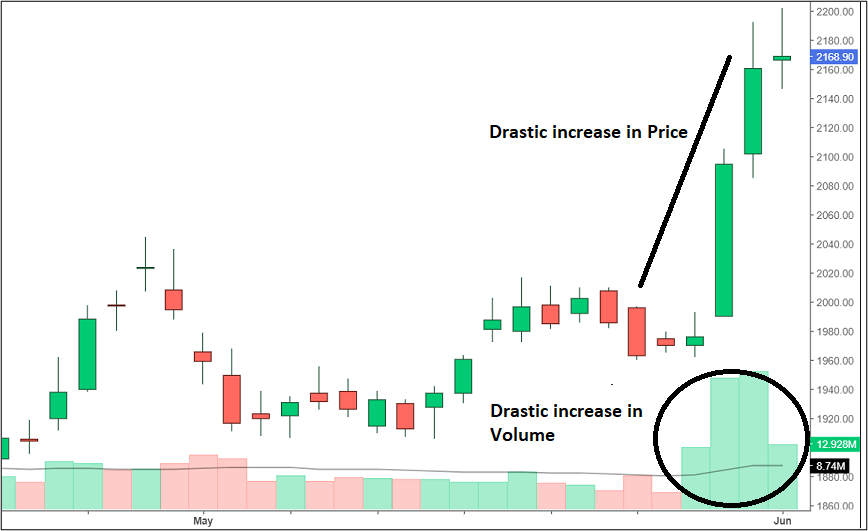
How Volume Confirms Price Movements
When price moves with corresponding volume spikes, the move has substance. As cited in institutional studies, breakouts paired with strong volume validation have dramatically higher success rates than those without volume support. If the price breaks above resistance on high volume, it indicates genuine demand—likely driven by deep-pocketed players. Low-volume moves are often false signals or “stop hunts,” quickly fading once liquidity dries up.
Core Principles of Volume Analysis
The Volume-Price Relationship
The interplay between price and volume is foundational. Strong price advances with rising volume typically signal accumulation: institutions are buying, often in stealth, as retail traders watch. On declines, high volume suggests distribution—smart money is quietly exiting. The lack of accompanying volume on price advances or declines is a red flag: it reveals waning interest and the potential for reversals.
An advanced application is the “effort versus result” principle from Wyckoff methodology: substantial volume without proportional price move hints at large-scale accumulation or distribution, depending on market phase. As one trading platform analysis noted, this pattern helped forecast explosive rallies in stocks like NVIDIA and COIN after months of tightening ranges and vanishing volume. As a Reddit user, u/chartdiver, put it: “If the price breaks out but there’s no volume party—expect the hangover, not the rally.”
Key Volume Patterns
- High-volume breakout: Signals conviction; genuine buying interest supporting new highs or lows.
- Low-volume pullback: Indicates temporary weakness; trend likely to resume as supply dries up.
- Volume climax: Marks exhaustion—usually at the end of trends—preceding reversal or consolidation.
- Narrow-range + high volume: Implies institutional absorption—smart money stacking positions without pushing price much.
Smart Money and Volume Analysis
Defining Smart Money
“Smart money” refers to experienced, institutional traders—mutual funds, hedge funds, investment banks—wielding enough capital to shape trends. Unlike retail traders, who chase price action, institutions methodically accumulate during corrections and quietly distribute into euphoria.
As documented in recent academic studies of Reddit-driven activity, retail investor surges create temporary volume spikes. Still, sustainable trends almost always require institutional backing.
Detecting Smart Money Flow
Institutions can’t move in and out unnoticed—but they try. Volume analysis brings their “footprints” into focus using techniques such as:
- On-Balance Volume (OBV): Tracks whether volume is supporting uptrends or downtrends. Sustained OBV divergence from price often hints at institutional accumulation beneath the surface.
- Accumulation/Distribution Line (ADL): Goes further, weighting volume based on where price closes within its daily range—capturing subtle institutional buying or selling on recoveries from intraday lows.
- Bespoke trading indicators like Chaikin Money Flow and Volume Profile uncover where smart money “clusters” their orders—often at support/resistance zones invisible in price action alone.
Real-world examples abound: on TradingView and Quantitative Discussion forums, traders consistently highlight how OBV divergences pre-empt price reversals by several days to weeks, giving a crucial edge to patient traders.
Practical Volume Analysis Techniques
Using Volume in Technical Analysis
The best volume indicators for smart money flow detection include:
- Volume Moving Averages: Smooth out daily noise to reveal breakouts or trend confirmations.
- Schaff Trend Cycle: Pinpoints turning points by cross-referencing price and volume cycles.
- Volume Profile and VWAP: Expose price levels where institutions have heavily loaded positions, serving as magnets for future price action.
According to a performance review cited in order flow research, breakout trades paired with 2–3x average volume boast a staggering 70%-plus success rate, compared to “naked” breakouts that fail more than half the time.
Scenario Analysis and Case Study
Consider the case of NVIDIA (NVDA) in late 2023. As price tightened within a multi-month range, volume steadily declined—a classic sign of institutional accumulation. When the breakout finally arrived, volume spiked to several times its daily average, confirming commitment. Within weeks, NVDA rallied nearly 95% from its base. This repeatable pattern echoed in other growth stocks like SMCI and COIN, demonstrating how “quiet accumulation” foretells explosive moves when volume finally surges.
For Reddit-fueled names like GameStop, academic research found that surges in online mentions triggered brief, volatile volume spikes, but only institutional volume anchored sustainable price trends. As u/thetradingowl summed up: “Retail can make the fireworks, but the institutions set the direction.”
| Pattern | Smart Money Signal |
|---|---|
| High-volume on breakouts | Institutional buying |
| Low-volume on rallies | Weak trend, likely reversal |
| Volume climax at new highs | Distribution, potential top |
| Volume drying up in base | Accumulation, likely to explode on breakout |
Limitations and Challenges of Volume Analysis
Inherent Limitations of Volume Analysis
From my experience, volume analysis is powerful but imperfect. It lags, especially on smaller timeframes—by the time a volume spike prints, much of the move may be over. High-frequency trading introduces artificial volume, blurring distinctions between real and algorithmic action. Additionally, dark pool trading and after-hours blocks often go unreported, leaving blind spots in your analysis.
Market manipulation, including spoofing (placing/canceling large fake orders), creates false volume signals. Academic and professional reviews stress the importance of cross-referencing volume with order flow and price context to avoid being “shaken out” by apparent but insincere moves.
Overcoming Challenges
- Combine volume with other indicators like RSI, moving averages, and Wyckoff phases for confirmation.
- Analyze multi-timeframe volume: weekly data confirms longer-term accumulation or distribution, while daily and intraday data highlight real-time intent.
- Monitor social sentiment platforms (e.g., Reddit, QuiverQuant) but recognize that retail volume surges often coincide with institutional distribution, not sustainable trend initiation.
- Seek volume divergence: be skeptical of new price highs on declining volume, as this often heralds reversals or corrections.
Reddit, Retail Participation, and Institutional Volume
Emerging research focusing on meme stocks, such as the “WallStreetBets” effect, shows that retail-driven volume spikes can trigger short-term volatility but rarely drive lasting trends. One study found that even when Reddit mentions led trading volume by up to 30 minutes, these surges lacked staying power without institutional validation. True smart money flow, on the other hand, appears not as sudden spikes but as persistent, layered accumulation over weeks or months.
As u/datawizard observed in a discussion, “Reddit mobs can blow up volume in minutes, but the trend only sticks if the whales are swimming the same direction.” That blend of social visibility and patient, ongoing volume is what traders should watch to avoid getting caught at the tail end of retail euphoria.
Advanced Insights: Five Little-Known Facts
- Market makers and smart money often use stop-loss triggering and “liquidity grabs” to accumulate positions from impatient retail traders.
- Volume profile analysis reveals price “magnets”—POC (point of control)—where institutions have previously built large positions, predicting future support and resistance.
- Volume divergence, especially on multi-week highs or lows, is a leading—rather than lagging—indicator, commonly forecasting reversals before price confirms.
- Dark-pool activity means that public exchange volume data can underreport institutional involvement at key price levels, especially near major news or earnings.
- Most retail traders chase high-volume euphoria exactly when smart money is distributing stock, not accumulating, leading to poor performance if not interpreted correctly.
Additional Resources
- “Trades About to Happen” by David H. Weis – advanced volume spread analysis
- StockCharts On-Balance Volume Guide
- Investopedia: Accumulation/Distribution Line
- TradingView Volume Profile Community Ideas
- Chaikin Analytics Platform (Volume Tools)
- Also, QuiverQuant’s WallStreetBets tracking tool is a practical resource for sentiment/volume cross-reference.
Conclusion
Looking back on my own experience, integrating volume analysis into my market routine was a game-changer. The difference between a mere price pop and a true move backed by “smart money” participation became obvious once I started looking deeper than just charts. By using volume signatures, tools like OBV and Accumulation/Distribution, and keeping an eye on where retail enthusiasm peaks, I’ve avoided many classic traps and instead found myself on the right side of major market moves.
Step-by-step: I start with the basics—identifying price breakouts or breakdowns—then check if volume confirms or contradicts that move. Next, I overlay indicators like OBV or volume profile, reference longer timeframes for context, and monitor social sentiment to avoid chasing retail-driven hype. Finally, I wait for “effort vs. result” patterns or divergences to validate my conviction. This process has saved me from getting whipsawed and given me confidence to act when the odds truly favor me.
If you’re ready to transform your trade analysis, embrace volume as your market “x-ray” and practice these techniques alongside your current technical tools. I’d love to hear your thoughts, questions, or anecdotes—drop a comment below: how has volume analysis changed your trading?