

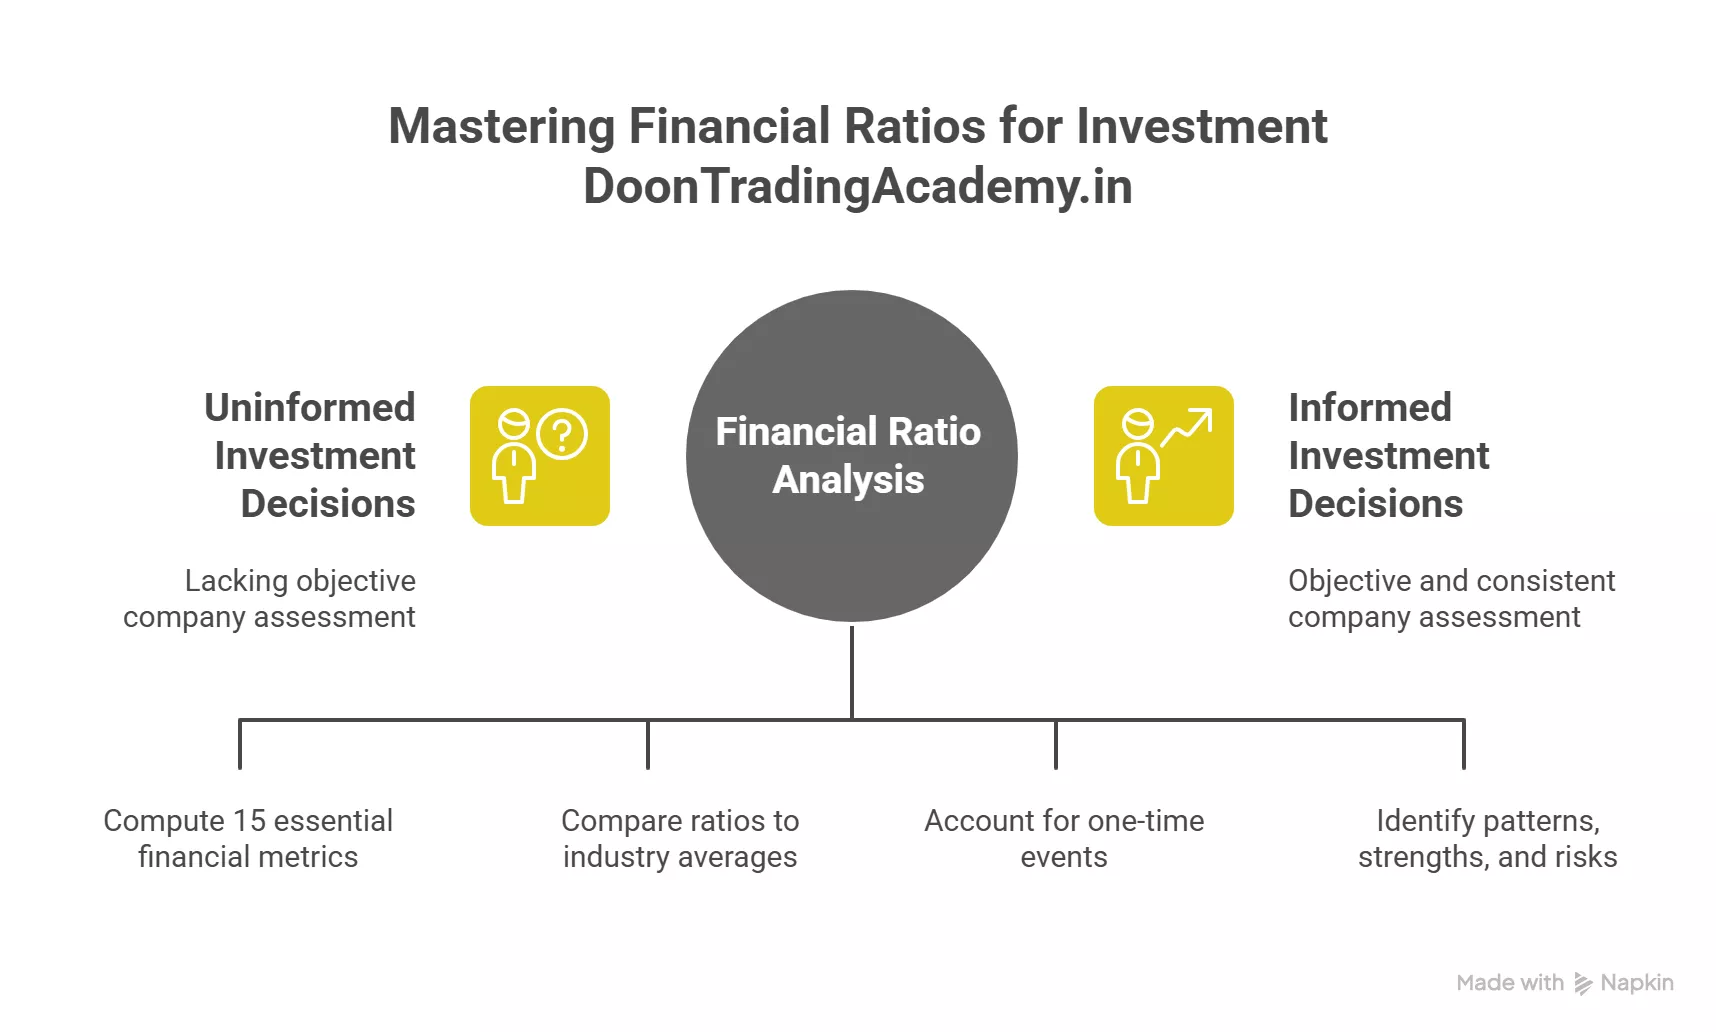
As an investor, one of the most powerful ways I’ve evaluated whether a company is healthy or worth my money is by using financial ratios. These formulas help me look past the surface to truly assess a business’s profitability, efficiency, ability to pay its bills, and growth potential. By translating sprawling financial statements into simple numbers, financial ratios calculate company performance in a way that’s both objective and comparably consistent—no matter the industry or the size of the business. In this article, I’ll walk you through the essential 15 key financial metrics every investor should master, illustrating not just how to calculate them but also what insights they actually unlock. Whether you’re new to investing or want to sharpen your analytical edge, understanding these ratios is crucial for making smart investment decisions.
Quick Summary
- Financial ratios help investors objectively assess company performance—across profitability, liquidity, efficiency, solvency, and valuation.
- There are five main categories: Profitability, Liquidity, Efficiency, Solvency/Leverage, and Market Value.
- No single ratio is enough; a holistic approach using multiple metrics provides a clearer financial picture.
- Industry context and trends are critical for accurately comparing ratios.
- Beware of limitations like accounting tricks, sector differences, sudden non-recurring events, and relying on just one metric.
1. Understanding Financial Ratios Calculate Company Performance
Financial ratios are tools that compare two sets of data from a company’s financial statements. They let investors and analysts evaluate anything from how fast a company collects payments to how well it turns investments into profits. There are five broad categories:
- Liquidity Ratios: Can the company pay its upcoming bills?
- Profitability Ratios: Is the business earning a healthy profit on what it sells and owns?
- Efficiency (Activity) Ratios: How effectively are assets being used or managed?
- Solvency (Leverage) Ratios: How risky is the company’s level of debt compared to its assets or equity?
- Market Value Ratios: Is the stock overvalued, undervalued, or fairly valued?
By analyzing ratios within these categories, we can begin to see a company’s strengths, weaknesses, and hidden risks that raw dollars and cents simply don’t reveal.
2. Liquidity Ratios
Current Ratio
This ratio measures whether a company can pay its short-term obligations using current assets (like cash, inventory, and receivables). A current ratio above 1.0 usually means healthy liquidity, but industry differences are key. For example, hotel and airline companies can safely operate with lower current ratios due to predictable cash flow cycles.
- Formula: Current Ratio = Current Assets / Current Liabilities
| Current Ratio Interpretation | Example |
|---|---|
| Above 1.0 | Likely to meet short-term obligations |
| Below 1.0 | Potential liquidity concerns |
Quick Ratio
Also known as the “acid test,” the quick ratio excludes inventory (which can be slow to sell) to paint a more immediate liquidity picture. If quick assets barely cover current debts, cash crunches could follow.
- Formula: Quick Ratio = (Current Assets – Inventory) / Current Liabilities
3. Profitability Ratios
Net Profit Margin
This ratio shows what percentage of revenue remains as net profit after all expenses. High margins often mean pricing power, cost efficiency, or both. Service sectors typically post higher margins than retail.
- Formula: Net Profit Margin = Net Income / Revenue
An experienced Redditor, user BigMoneyBuffet, shared: “I always check the net margin trends first. If a company can grow revenue AND boost margins, that’s a winning combo in my book.”
Return on Assets (ROA)
ROA tracks how resourcefully a business uses all its assets to generate profit. It’s especially useful for capital-intensive industries, like railways or telecom, where expensive assets can drag down this figure.
- Formula: ROA = Net Income / Total Assets
Return on Equity (ROE)
This ratio is a shareholder favorite, showing how much profit management returns for every dollar investors own. A high, stable ROE is often a hallmark of a well-run company. But beware of artificially boosted ROEs caused by excessive debt.
- Formula: ROE = Net Income / Average Shareholder’s Equity
| Industry ROE Norm | Typical Range |
|---|---|
| Tech | 15%–30% or higher |
| Utilities | 8%–15% |
4. Efficiency Ratios
Asset Turnover Ratio
This tells investors how efficiently a company turns assets into sales. Higher numbers mean assets are being put to productive use. Retailers often have higher asset turnover than heavy manufacturers, for example.
- Formula: Asset Turnover = Net Sales / Average Total Assets
Inventory Turnover Ratio
This tracks how quickly inventory is sold and replaced. Fast turnover points to strong demand and lean management, but ultra-high turns may risk stockouts. The key is balance. For fast fashion, high is good; for fine jewelry, lower is fine.
- Formula: Inventory Turnover = Cost of Goods Sold / Average Inventory
| Industry | Inventory Turnover Typical Value |
|---|---|
| Grocery Stores | 14–18 |
| Jewelry Stores | 2–3 |
5. Solvency Ratios
Debt to Equity Ratio
This ratio reveals how much the company relies on loans versus internal funds. It’s a basic risk gauge—companies with lots of debt (high D/E) often face higher financial risk, especially if profits slide.
- Formula: Debt to Equity = Total Liabilities / Total Equity
Interest Coverage Ratio
This tests how easily operating profits cover the cost of debt. If the ratio drops below 1.0, the company isn’t earning enough from operations to pay interest—an obvious red flag for investors.
- Formula: Interest Coverage = EBIT / Interest Expense
As one r/ValueInvesting forum user put it: “A rising interest coverage means a margin of safety—not just for creditors but for equity holders too. If it tanks, start worrying.”
6. Market Value Ratios
Price to Earnings (P/E) Ratio
The P/E ratio tells us how much investors are willing to pay per dollar of company earnings. A high P/E often means high growth expectations, but it’s dangerous to compare P/Es blindly across industries. Just because a stock trades at a higher P/E doesn’t mean it’s overpriced if its earnings are growing faster than peers.
- Formula: P/E = Share Price / Earnings Per Share
| P/E Ratio Interpretation | Example |
|---|---|
| High (e.g., 25+) | Expecting rapid future growth |
| Low (e.g., <10) | Possible undervaluation or slowing growth |
Market to Book Ratio (P/B)
The P/B compares the market value of a stock to its book value (essentially, what shareholders would get if the company was liquidated). A P/B under 1.0 can mean the company’s assets are undervalued, but for asset-light innovators, high P/B is often normal.
- Formula: P/B = Share Price / Book Value Per Share
7. Growth Ratios
Earnings Per Share (EPS) Growth
This measures how quickly a company increases the profit “pie” per share over time. Sustained, strong EPS growth often leads to higher stock prices and rising dividends.
- Formula: EPS Growth Rate = (Current EPS – Previous EPS) / Previous EPS
Revenue Growth Rate
Investors love stable, accelerating sales since it usually signals a solid product, marketing, or industry advantage. Dependable revenue growth is the lifeblood of sustainable expansion.
- Formula: Revenue Growth Rate = (Current Revenue – Previous Revenue) / Previous Revenue
For example, Maison Solutions reported an impressive 114% increase in net revenues for FY2025, mostly driven by fresh acquisitions—evidence of how this metric can spotlight rapidly rising businesses.
8. Applying Financial Ratios: Comparative & Historical Analysis
Most seasoned investors (myself included) never look at ratios in a vacuum. Instead, we compare a company’s ratios to:
- Direct competitors (to see if it’s outperforming or lagging)
- Sector averages or benchmarks
- The company’s own historical performance (to find positive or negative trends)
For example, Microsoft’s historically “low” P/E in 2010 gave savvy investors a powerful buy signal, since its growth trajectory was far stronger than the market acknowledged at that time. As one analyst quipped on the Bogleheads forum: “Buy the tech giant the market forgot. The story is in the ratios—not the headlines.”
9. Limitations of Financial Ratios
I’ve learned firsthand that ratios aren’t perfect. Here’s what to watch out for:
- Sector differences: What’s high for one industry may be normal for another—context is everything.
- Accounting manipulation: Companies like Enron famously hid bad news off the books, making ratios look better than reality.
- One-off events: Large legal settlements or asset sales can temporarily distort profitability measures.
- Overreliance on a single ratio: Always combine different metrics for a full financial portrait.
Reddit user numbersguy101 put it well: “Ratios are like the instruments on a plane’s dashboard—trust them, but don’t fly blind. Always read the footnotes before you chart a course.”
10. Five Beyond-Obvious Insights from the Research
- Industry context trumps raw numbers. For example, a current ratio of 0.7 is dangerously low for many companies but perfectly normal—and even healthy—for airlines due to advance ticket cash flows.
- The DuPont Analysis (decomposing ROE) uncovers whether strong returns stem from profits, efficient asset use, or leverage—key for separating genuine business quality from risky financial engineering.
- The PEG ratio (P/E divided by earnings growth) popularized by Peter Lynch, is rarely below 1.0 for major markets—showing how true “bargains” are far rarer than textbooks imply, especially in today’s markets.
- Free cash flow is more predictive than net profit. Companies can appear profitable on paper but burn cash due to aggressive investment—something traditional ratios (like net margin) might temporarily miss.
- Reading footnotes is the investor’s secret weapon. Vital information about off-balance-sheet liabilities, accounting changes, or segment performance is often buried out of sight, beyond the main ratios.
11. Troubleshooting Common Pitfalls in Ratio Analysis (from My Experience)
- If a ratio looks “off,” always check for recent, one-time events or accounting changes. One year’s huge asset sale or a big lawsuit loss can throw off trends—and these outliers are explained in management’s discussion or the financial statement footnotes.
- Don’t compare ratios across wildly different industries. In my early investing days, I made the mistake of comparing a capital-light tech company’s metrics with an old-school manufacturer—the results were misleading at best.
- Mixing up trailing (past) and forward (future) metrics leads to confusion, especially with P/E ratios. Nail down which you’re using and why.
- If a company’s numbers are “too good to be true,” double-check cash flow ratios and footnotes. Aggressive accounting and “financial engineering” can make even loss-making companies look profitable short-term!
12. Step-by-Step Process for Using Financial Ratios
- Start by selecting a group of relevant peer companies and gather three to five years of their financial statements.
- Calculate the key ratios in each of the five categories for each company and time period.
- Benchmark results—compare against industry averages, competitor metrics, and historical company trends.
- Flag major deviations for deeper investigation (could be red flags or hidden opportunities).
- Map out the story behind each key movement—read management commentary, footnotes, and supplementary disclosures.
- Synthesize your findings. See how profitability, liquidity, growth, efficiency, and market value interact. Use this full view to inform buy/sell/hold decisions—don’t let a single number sway you.
13. References and Suggested Reading
- “Financial Statement Analysis: A Practitioner’s Guide” by Martin Fridson & Fernando Alvarez
- Morningstar’s guide to financial ratios
- CFA Institute Blogs: The PEG Ratio’s limitations
- r/ValueInvesting, r/StockMarket, r/FinancialPlanning—. debates and real examples
- SEC’s EDGAR database for raw company filings and footnotes
Conclusion
From my own investing journey, I can say that learning how financial ratios calculate company performance was a turning point in my confidence and results. I’ve watched how ratios like ROE, current ratio, and P/E provide lightning-fast snapshots—but I’ve also learned the importance of digging deeper, blending ratio analysis with context, narrative, and cash flow checks. Here’s the step-by-step process you can use:
- Gather recent (and multi-year) financial statements for your target company and its peers.
- Systematically compute and compare the 15 key financial ratios across the five main categories.
- Benchmark these numbers against sector averages and peer leaders.
- Adjust for any non-recurring items or major accounting quirks—check those footnotes!
- Synthesize the story: look for patterns, strengths, and risks that emerge from the numbers.
Mastering these 15 key ratios won’t guarantee investing success, but it will give you a massive edge in understanding the real drivers of company performance—beyond surface-level headlines or hype. If you have questions, want to share a ratio success (or horror) story, or disagree with any of my takes, I’d love to hear about it in the comments below!