


Learning to read stock market charts is one of the most important skills for any beginner investor or trader. When I first began analyzing charts, I realized quickly that simply knowing about a stock’s fundamentals wasn’t enough—market movements often follow recurring visual patterns that give insight into future price direction. By understanding these chart patterns and the psychology behind them, you’ll be better equipped to identify profitable opportunities and avoid some of the most common pitfalls. In this guide, I’ll walk you through six essential chart patterns every beginner should learn, break down their practical success rates, and share real trader insights to help you build a solid foundation for technical analysis.
Quick Summary
- Chart reading blends market psychology and pattern recognition with crucial risk management skills.
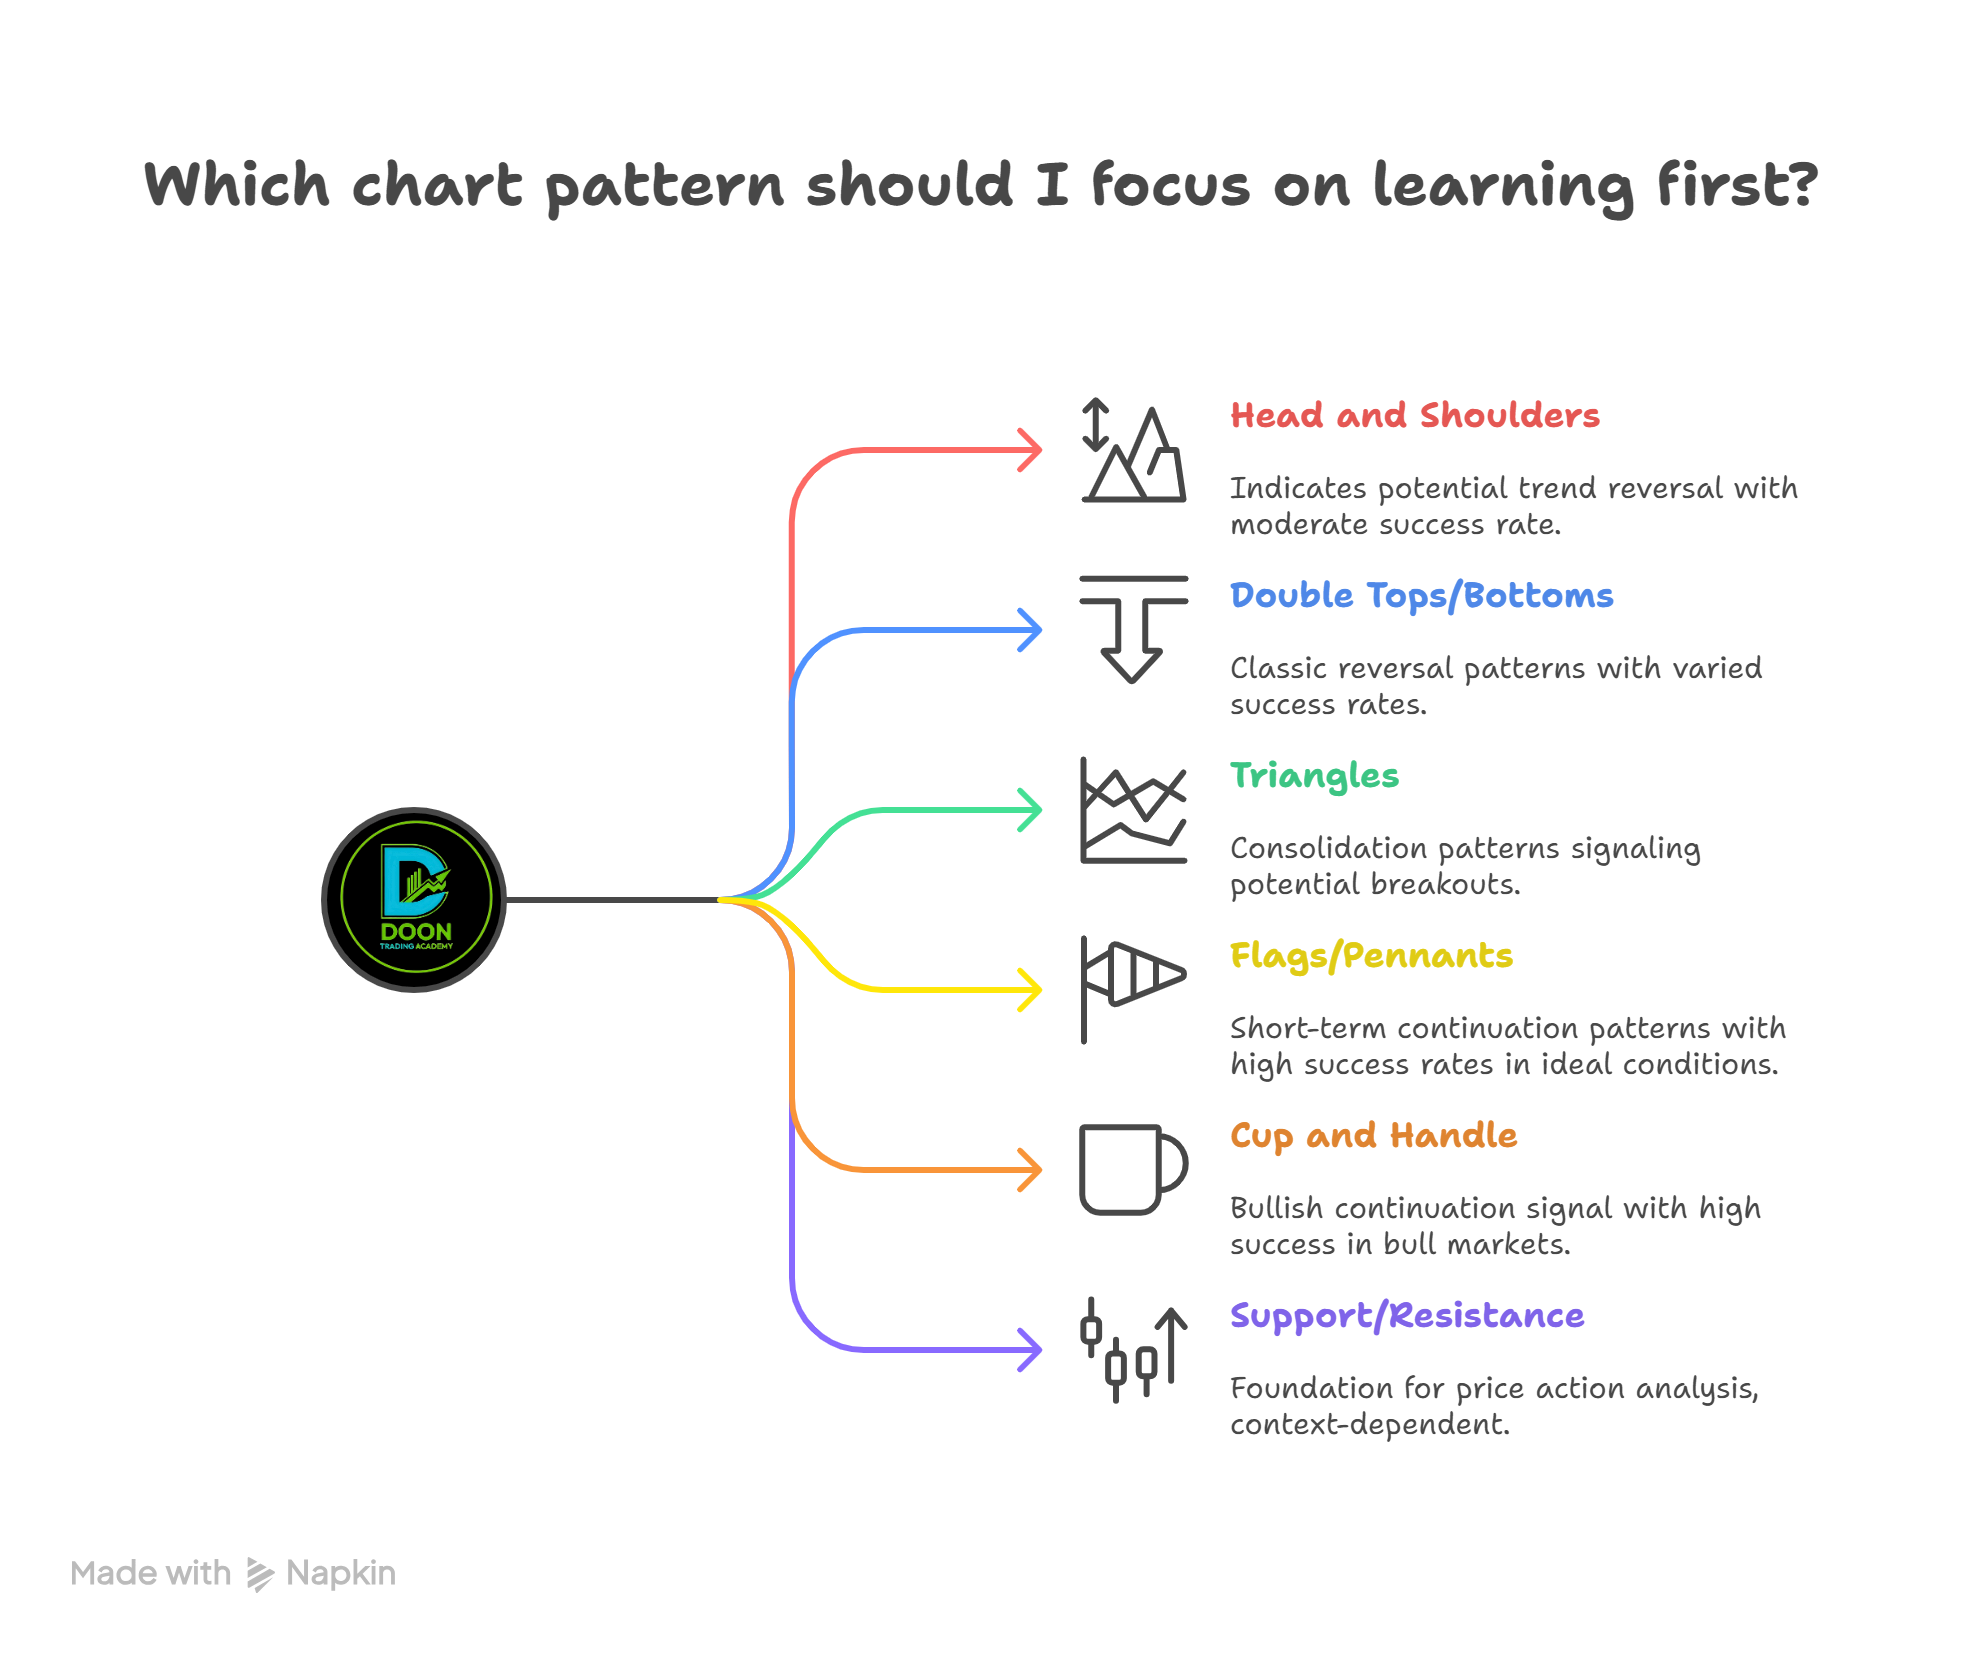
- Six patterns—Head and Shoulders, Double Tops/Bottoms, Triangles, Cup and Handle, Flags/Pennants, and Support/Resistance—are the most practical for beginners.
- Success rates for chart patterns in real-world trading are lower than often advertised (typically 50–70%).
- Volume confirmation and trend context make patterns more reliable.
- Risk management and mindset are just as important as spotting patterns.
Understanding Stock Market Charts
Stock market charts visually represent a stock’s price changes over time, using different chart types such as line, bar, or candlestick charts. The most popular among traders is the candlestick chart because it clearly shows the opening, closing, high, and low prices for a given period—but understanding the axes, color coding, and added indicators like moving averages or volume is key for interpretation.
Timeframes play a major role in chart analysis. While daily and weekly charts help spot major trends and robust patterns, shorter timeframes like 5-minute or 15-minute charts can be noisy and produce more false signals. Most experienced traders on forums like BabyPips advocate starting with higher timeframes and using smaller intervals only to fine-tune entries.
Why Patterns Matter in Stock Trading
Chart patterns are recurring visual formations on stock charts that can forecast future price moves based on historical price behavior and common trader psychology. They represent the interaction of buyers and sellers—essentially, market psychology in action. Identifying these patterns matters because they help traders spot high-probability setups, set logical target prices and stop-loss points, and manage their risk more effectively.
However, forum veterans warn that chart pattern success rates are often exaggerated by trading educators. According to user larphil on BabyPips: “Chart patterns are psychology based. They are not based on math or statistics or market condition. They are the mirror of the psychology and opinions of all market participants.” Trading success isn’t about memorizing every possible pattern but understanding what they reveal about real-time market sentiment.
The 6 Essential Chart Patterns for Beginners
Head and Shoulders
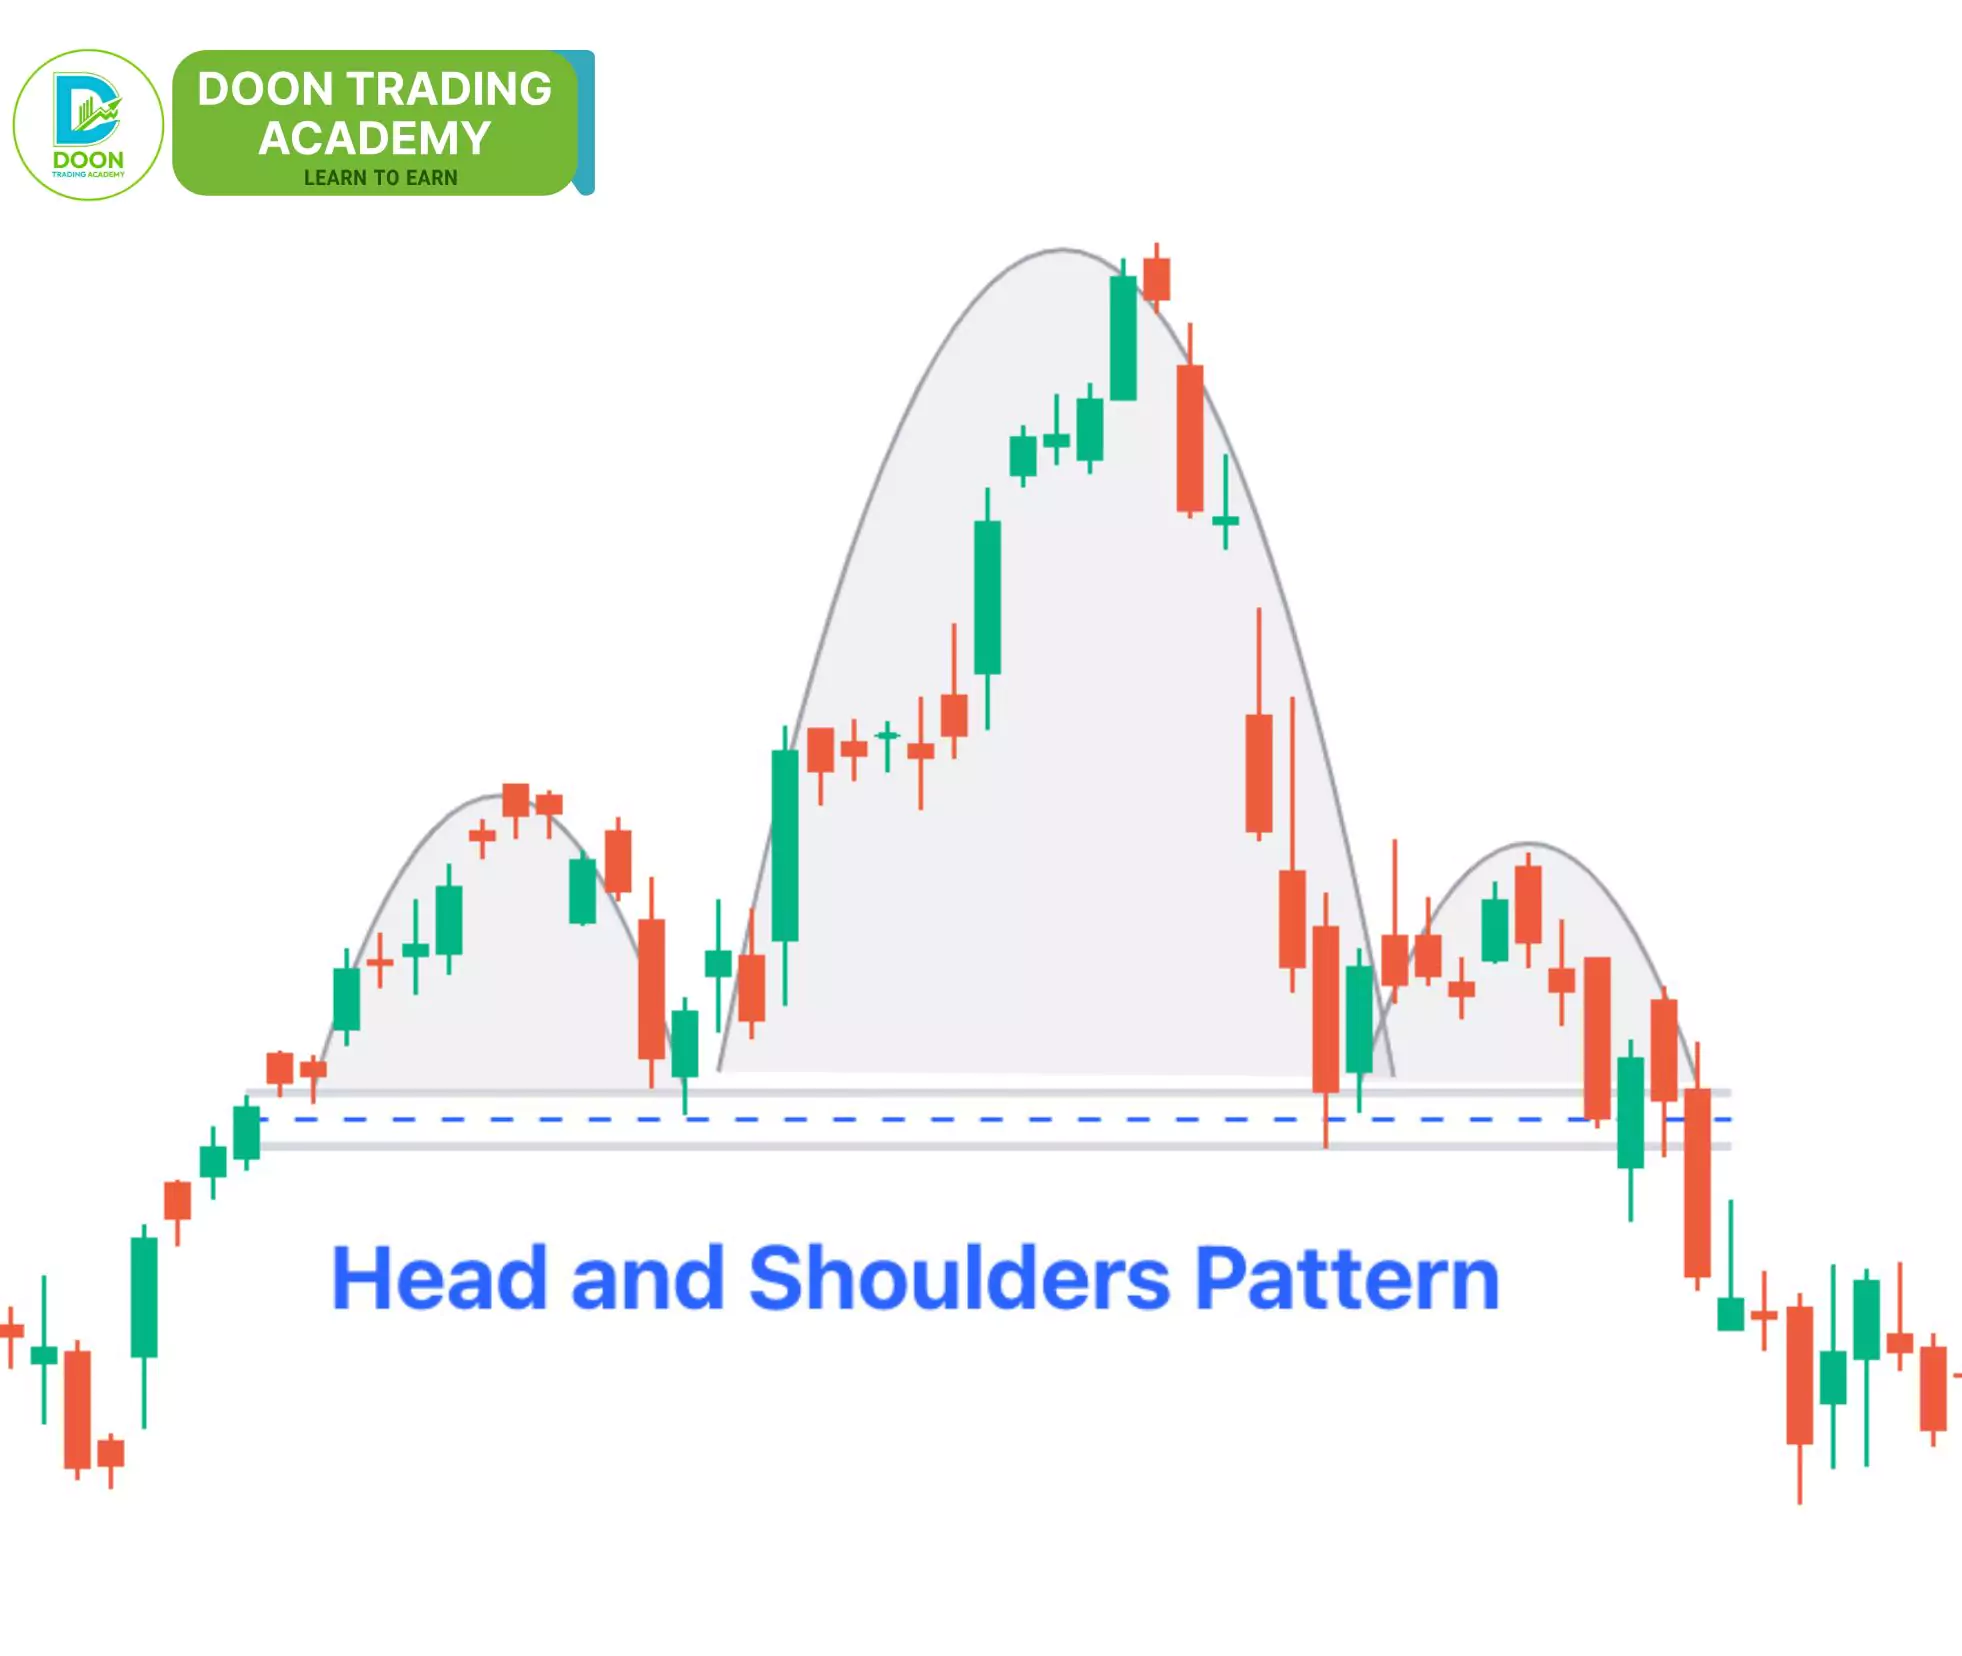
The head and shoulders pattern is a powerful reversal signal, indicating a trend’s exhaustion and a potential move in the opposite direction. It consists of three peaks: the higher ‘head’ between two similar ‘shoulders.’ When price breaks the ‘neckline’ connecting the two troughs, the reversal is confirmed. The inverse version signals the end of a downtrend.
While trading textbooks may boast 90% success rates, most backtested results position the Head and Shoulders pattern closer to 60% real-world effectiveness. As Rayner Teo notes in his YouTube tutorials, volume confirmation (rising volume at the breakout) is essential, and the pattern works best when properly proportioned and aligned with a broader trend reversal. In forums, traders often stress patience: “It works, but only when you don’t force it and the neckline break is clear,” writes PaulieD on The Trader’s Podcast community.
Double Tops and Double Bottoms
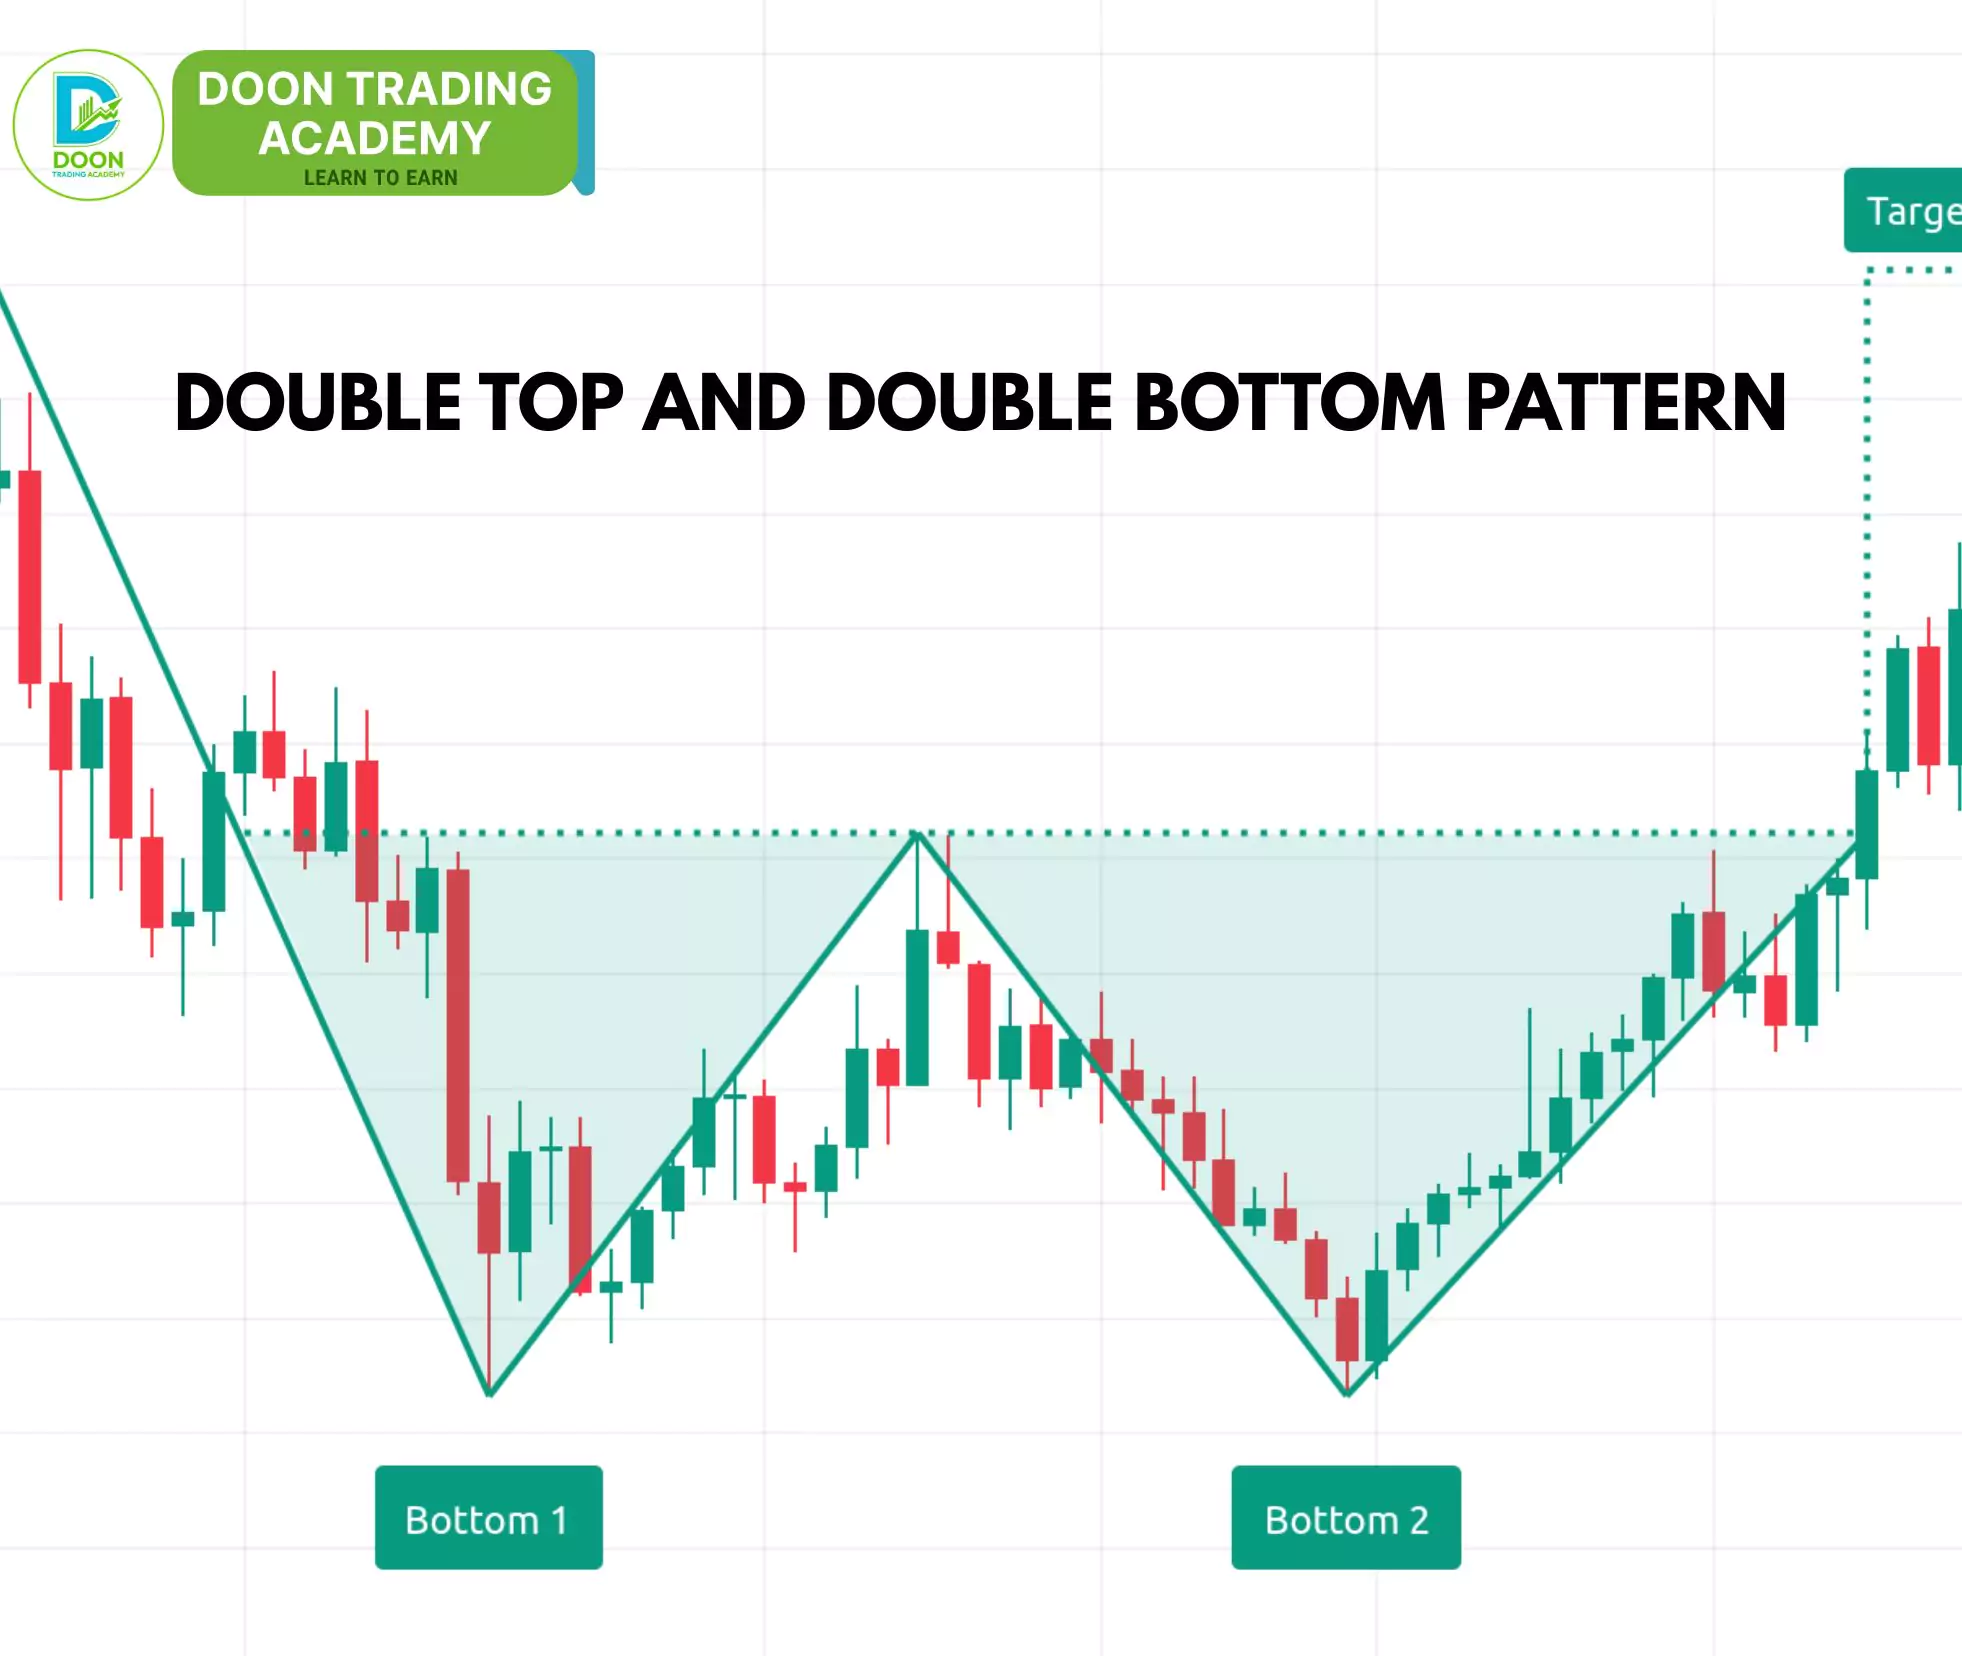
These classic reversal patterns form when price tests the same support or resistance level twice before reversing trend. A double top is bearish; a double bottom is bullish. Pattern reliability increases when the price moves away from the level with higher volume.
Quantitative studies show varied success—double bottoms, for example, reached their price target in just under 50% of backtested trades, though some datasets from bullish periods reported 68–81%. As user qube from Reddit’s r/Daytrading shares: “I used to chase every double top or bottom, but learned the hard way: without volume confirmation, fakeouts are common.”
Triangles (Ascending, Descending, Symmetrical)
Triangles are consolidation patterns marked by converging trendlines, signaling that buyers and sellers are locked in a tightening squeeze. Breakouts often lead to sizable moves. Ascending triangles favor upward breakouts, descending triangles point down, and symmetrical triangles are neutral until a breakout occurs.
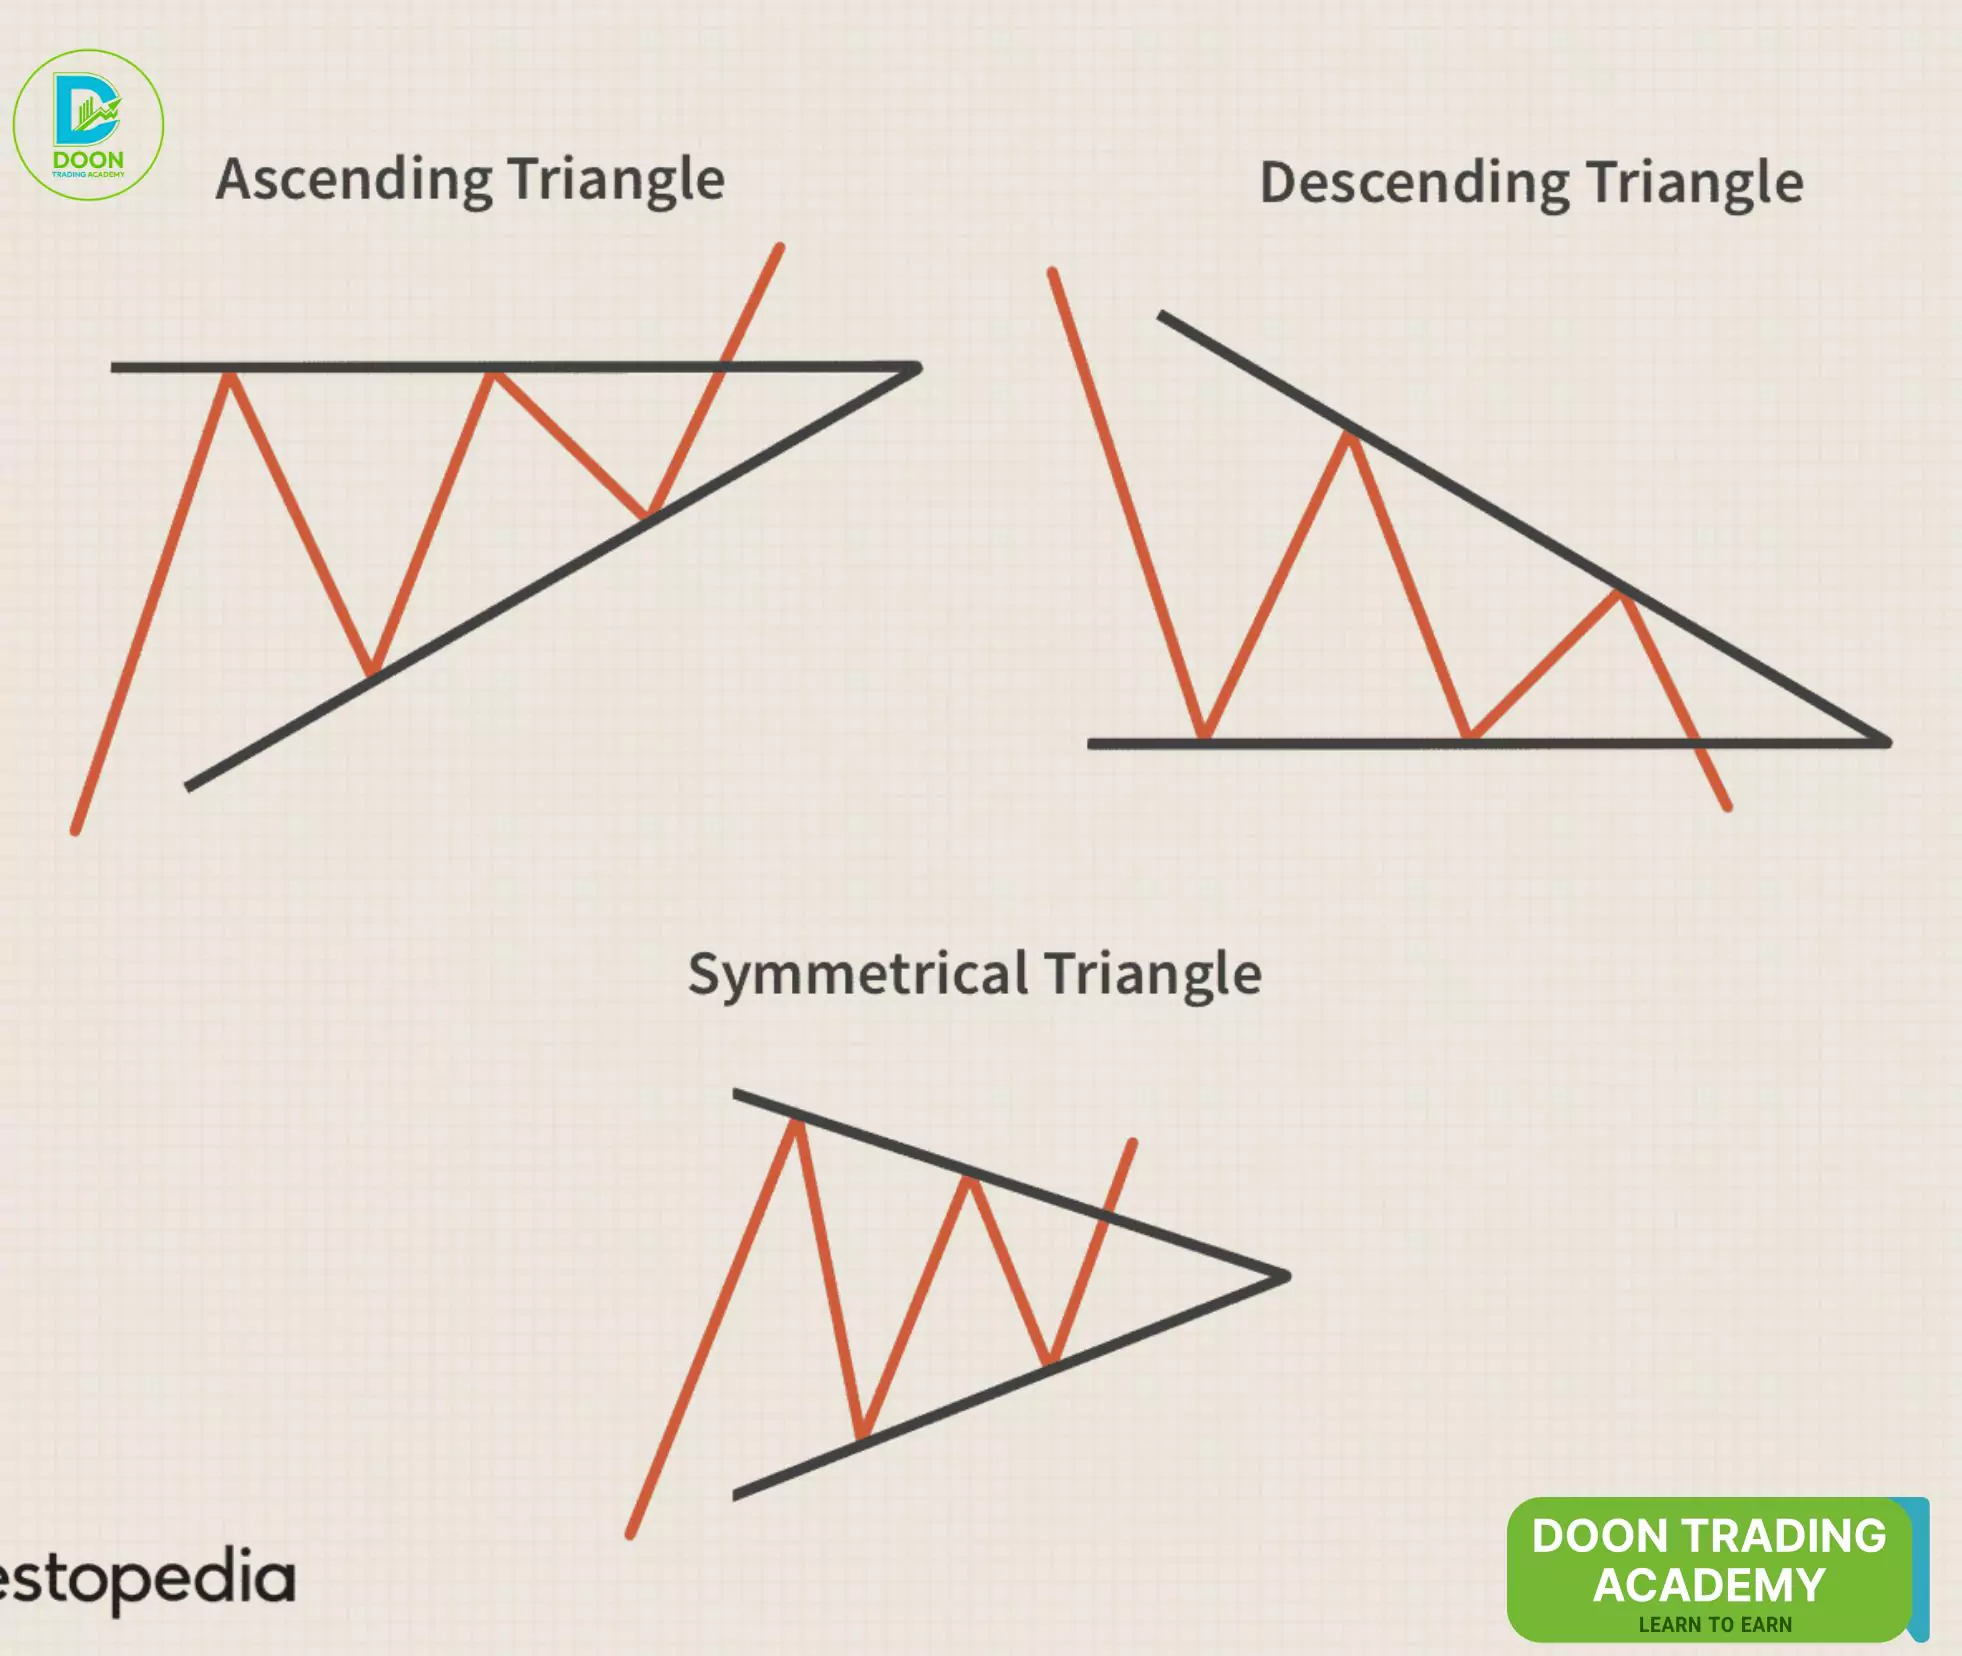
While some resources claim 75–87% breakout accuracy, real users report a significant number of false breakouts, especially on intraday charts. A contributor on BabyPips commented: “The trick is context—trade triangles with the dominant trend and wait for a volume spike.”
Flags and Pennants
Flags and pennants are short-term continuation patterns following a sharp price move (the flagpole), then a period of consolidation. Flags are rectangular channels; pennants are symmetrical triangles. The breakout typically occurs in the direction of the prior trend.
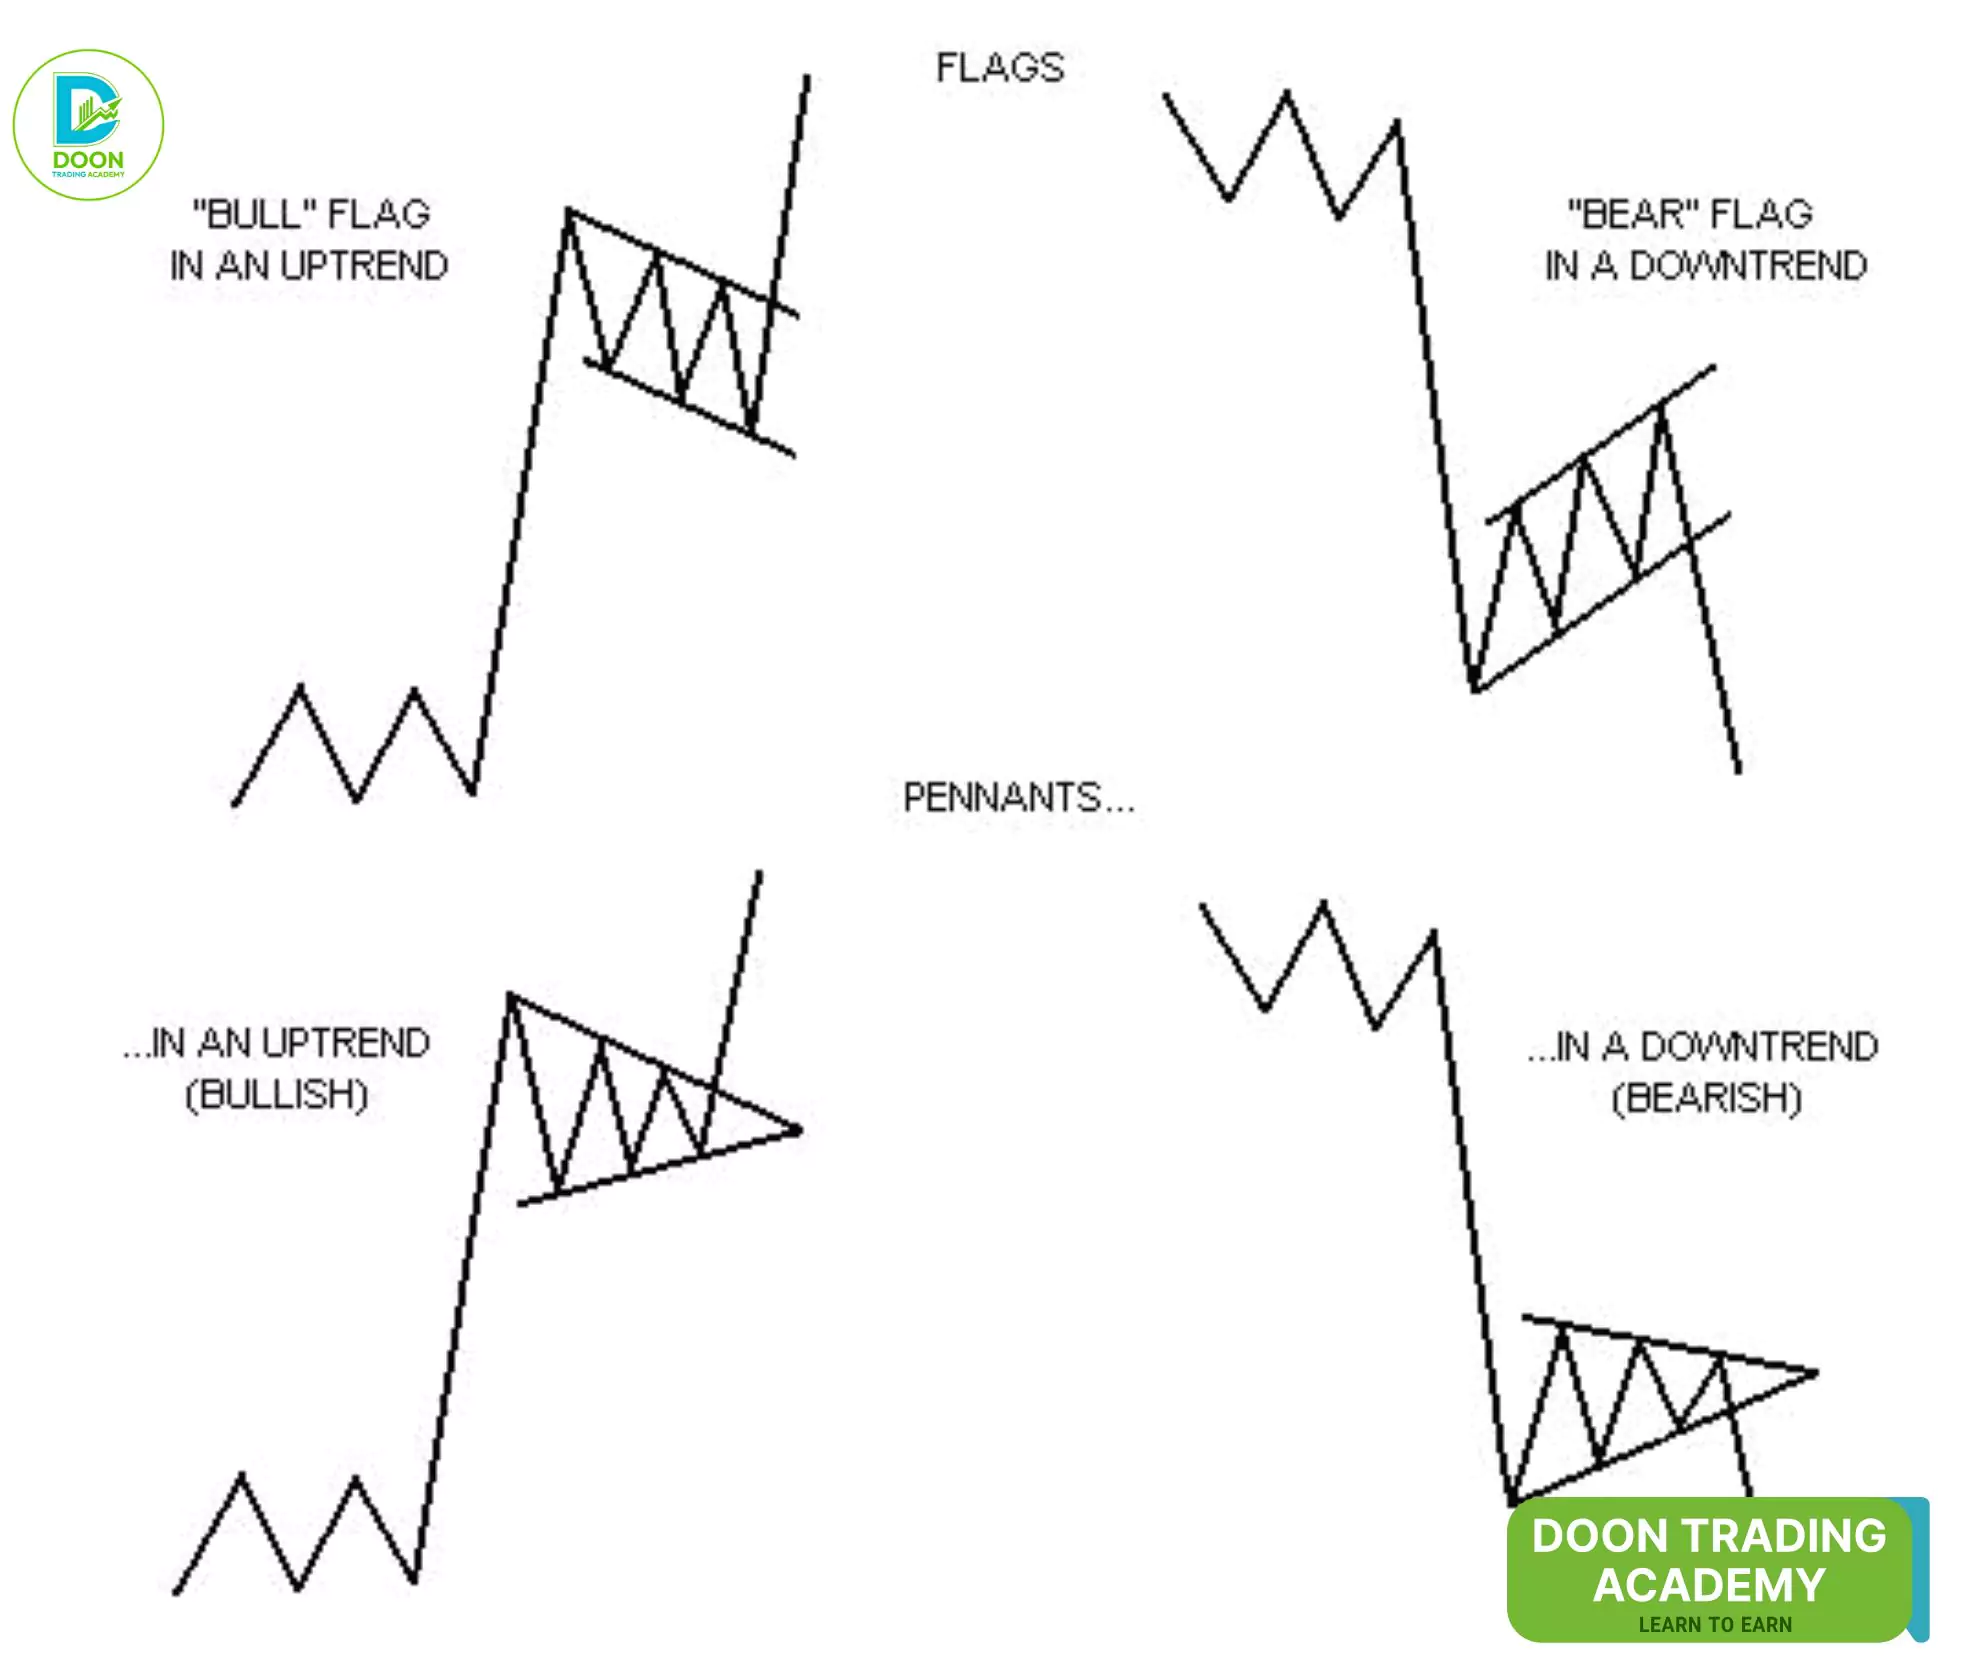
Backtests suggest 66–92% success in ideal conditions; however, with the modern market’s algorithmic trading, actual performance is more modest. Forum users recommend focusing only on those with clear flagpoles, orderly consolidation, and volume drop during the pattern, with a volume spike at the breakout. As StochasticShrimp on Reddit warns: “Don’t trade every flag you see. The story the volume tells is just as crucial as the shape.”
Cup and Handle
The cup and handle pattern is a bullish continuation signal, formed as the price rounds higher (the cup), faces resistance, then consolidates slightly downward (the handle). When price breaks out above the handle, it signals the continuation of the uptrend.
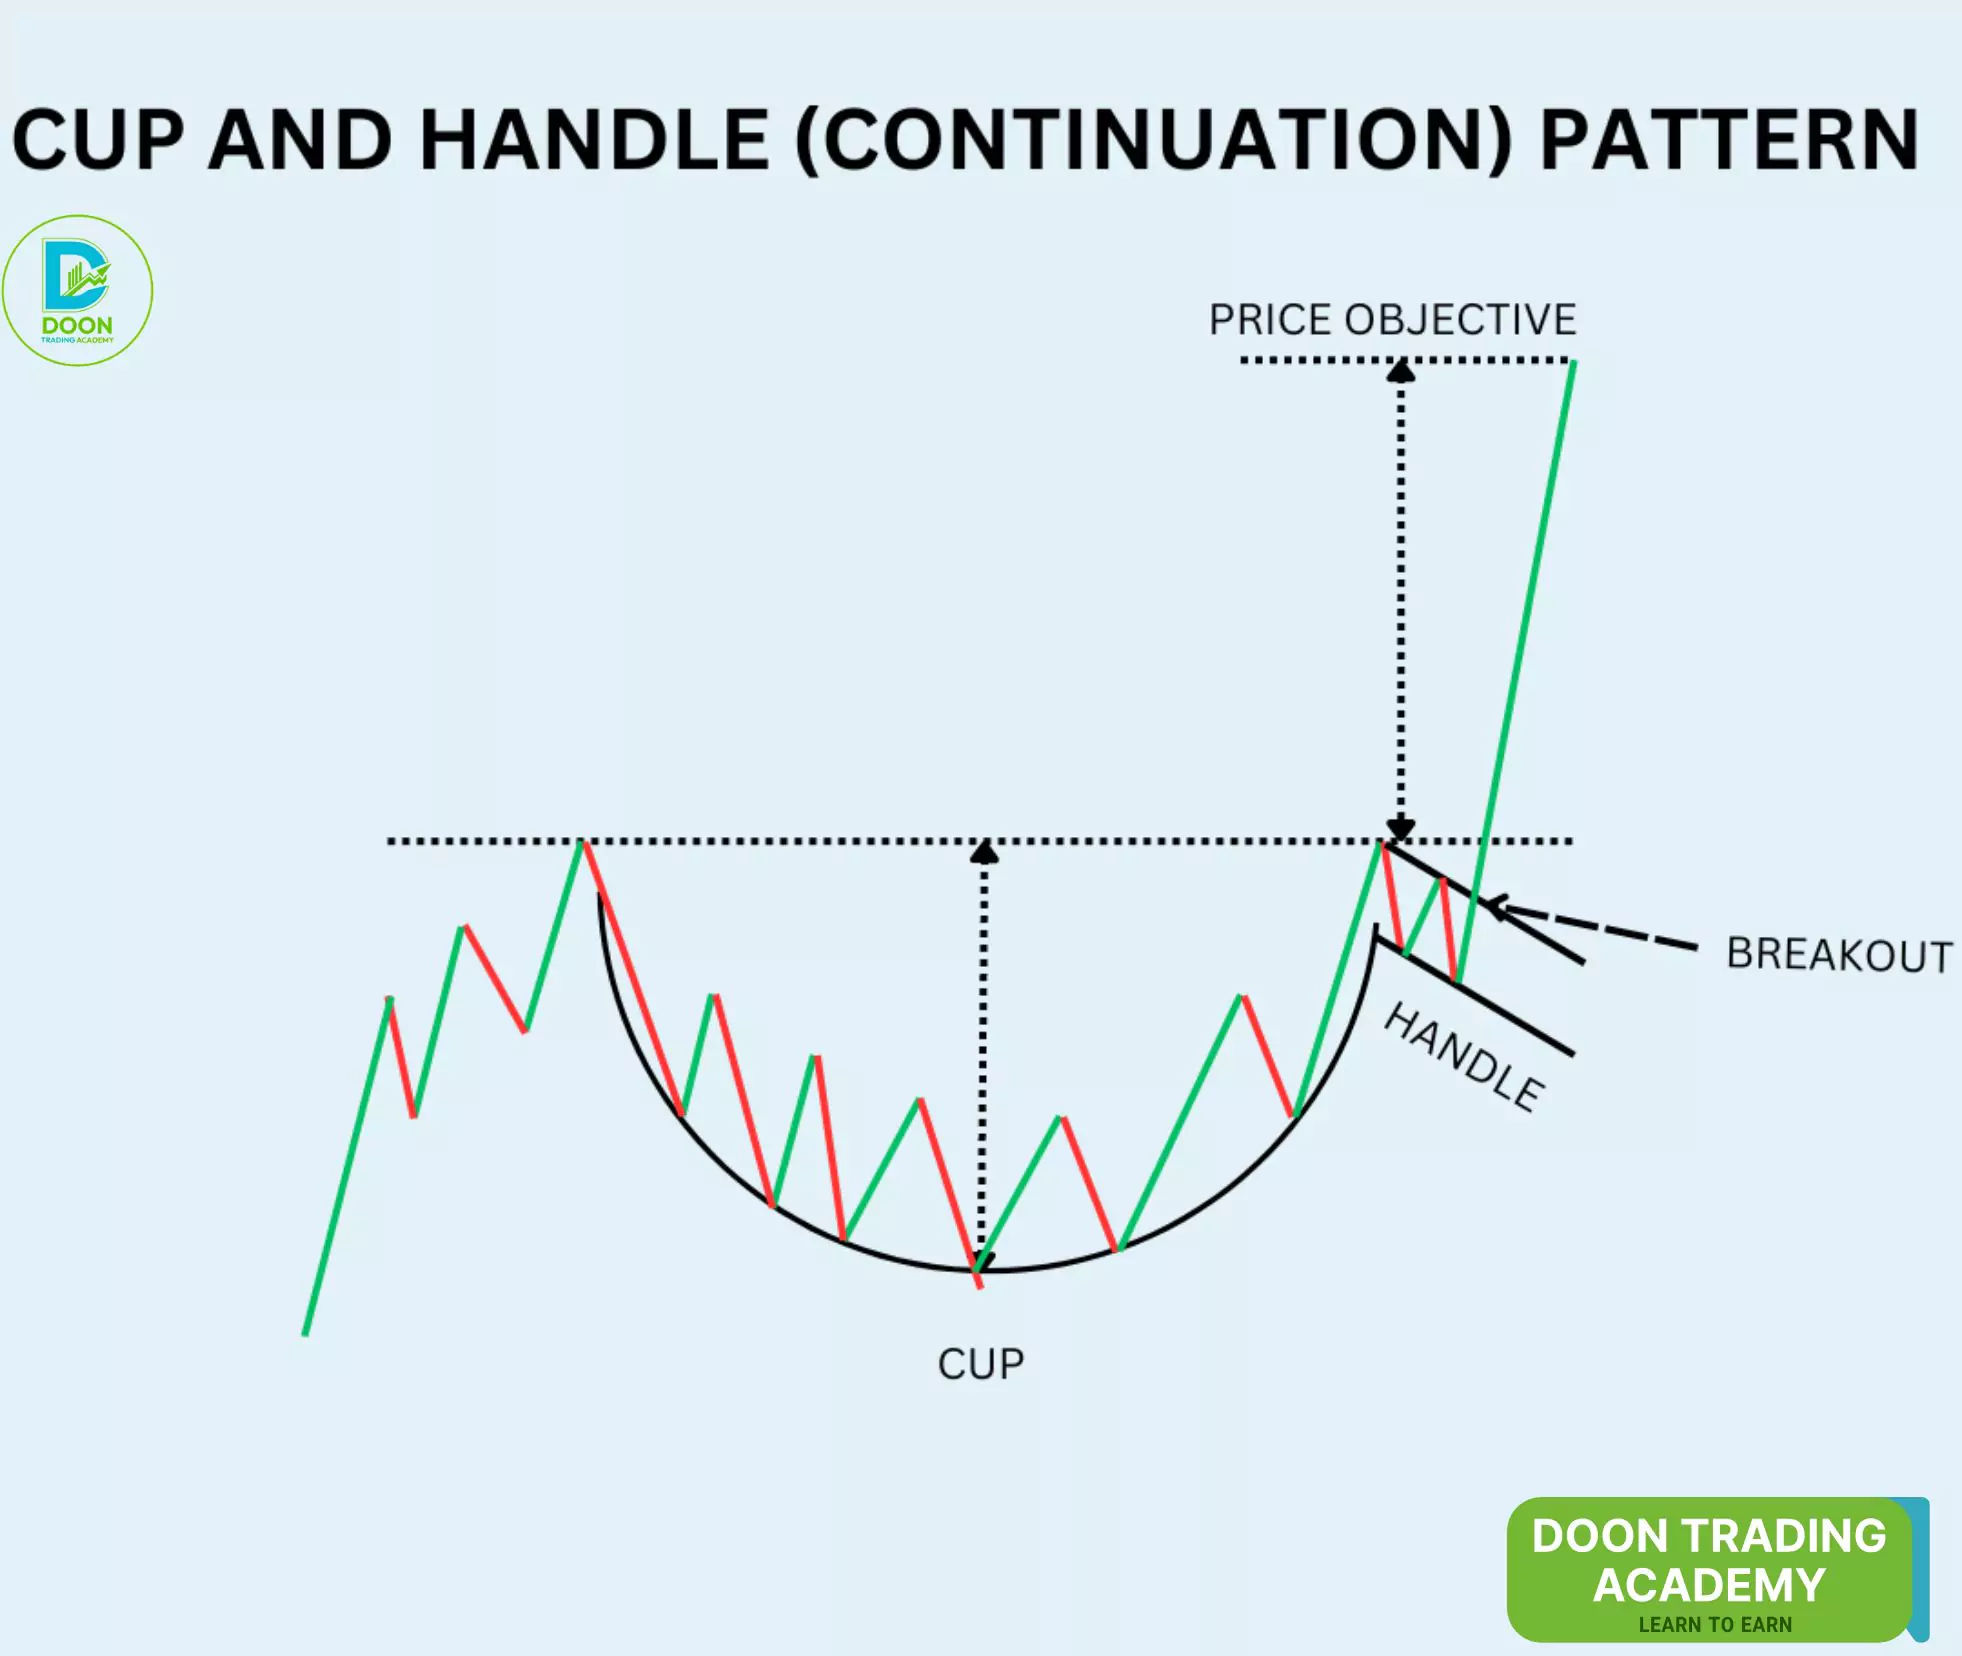
In bull markets, success rates for properly formed cups are as high as 95%, but the setup is rare. Thomas Bulkowski’s research puts the average gain at about 54% after breakout. Traders frequently misidentify short-term rounded patterns as cups, then face disappointment when breakouts fail. As veteran trader cTraderGuy on BabyPips advises: “Don’t fall for every curve that ‘looks like’ a cup; it’s the depth and length that count.”
Support and Resistance Levels
Support and resistance aren’t conventional chart patterns, but they are the foundation for all price action analysis. Support represents a demand zone prone to halting declines, while resistance marks a supply zone resisting advances.
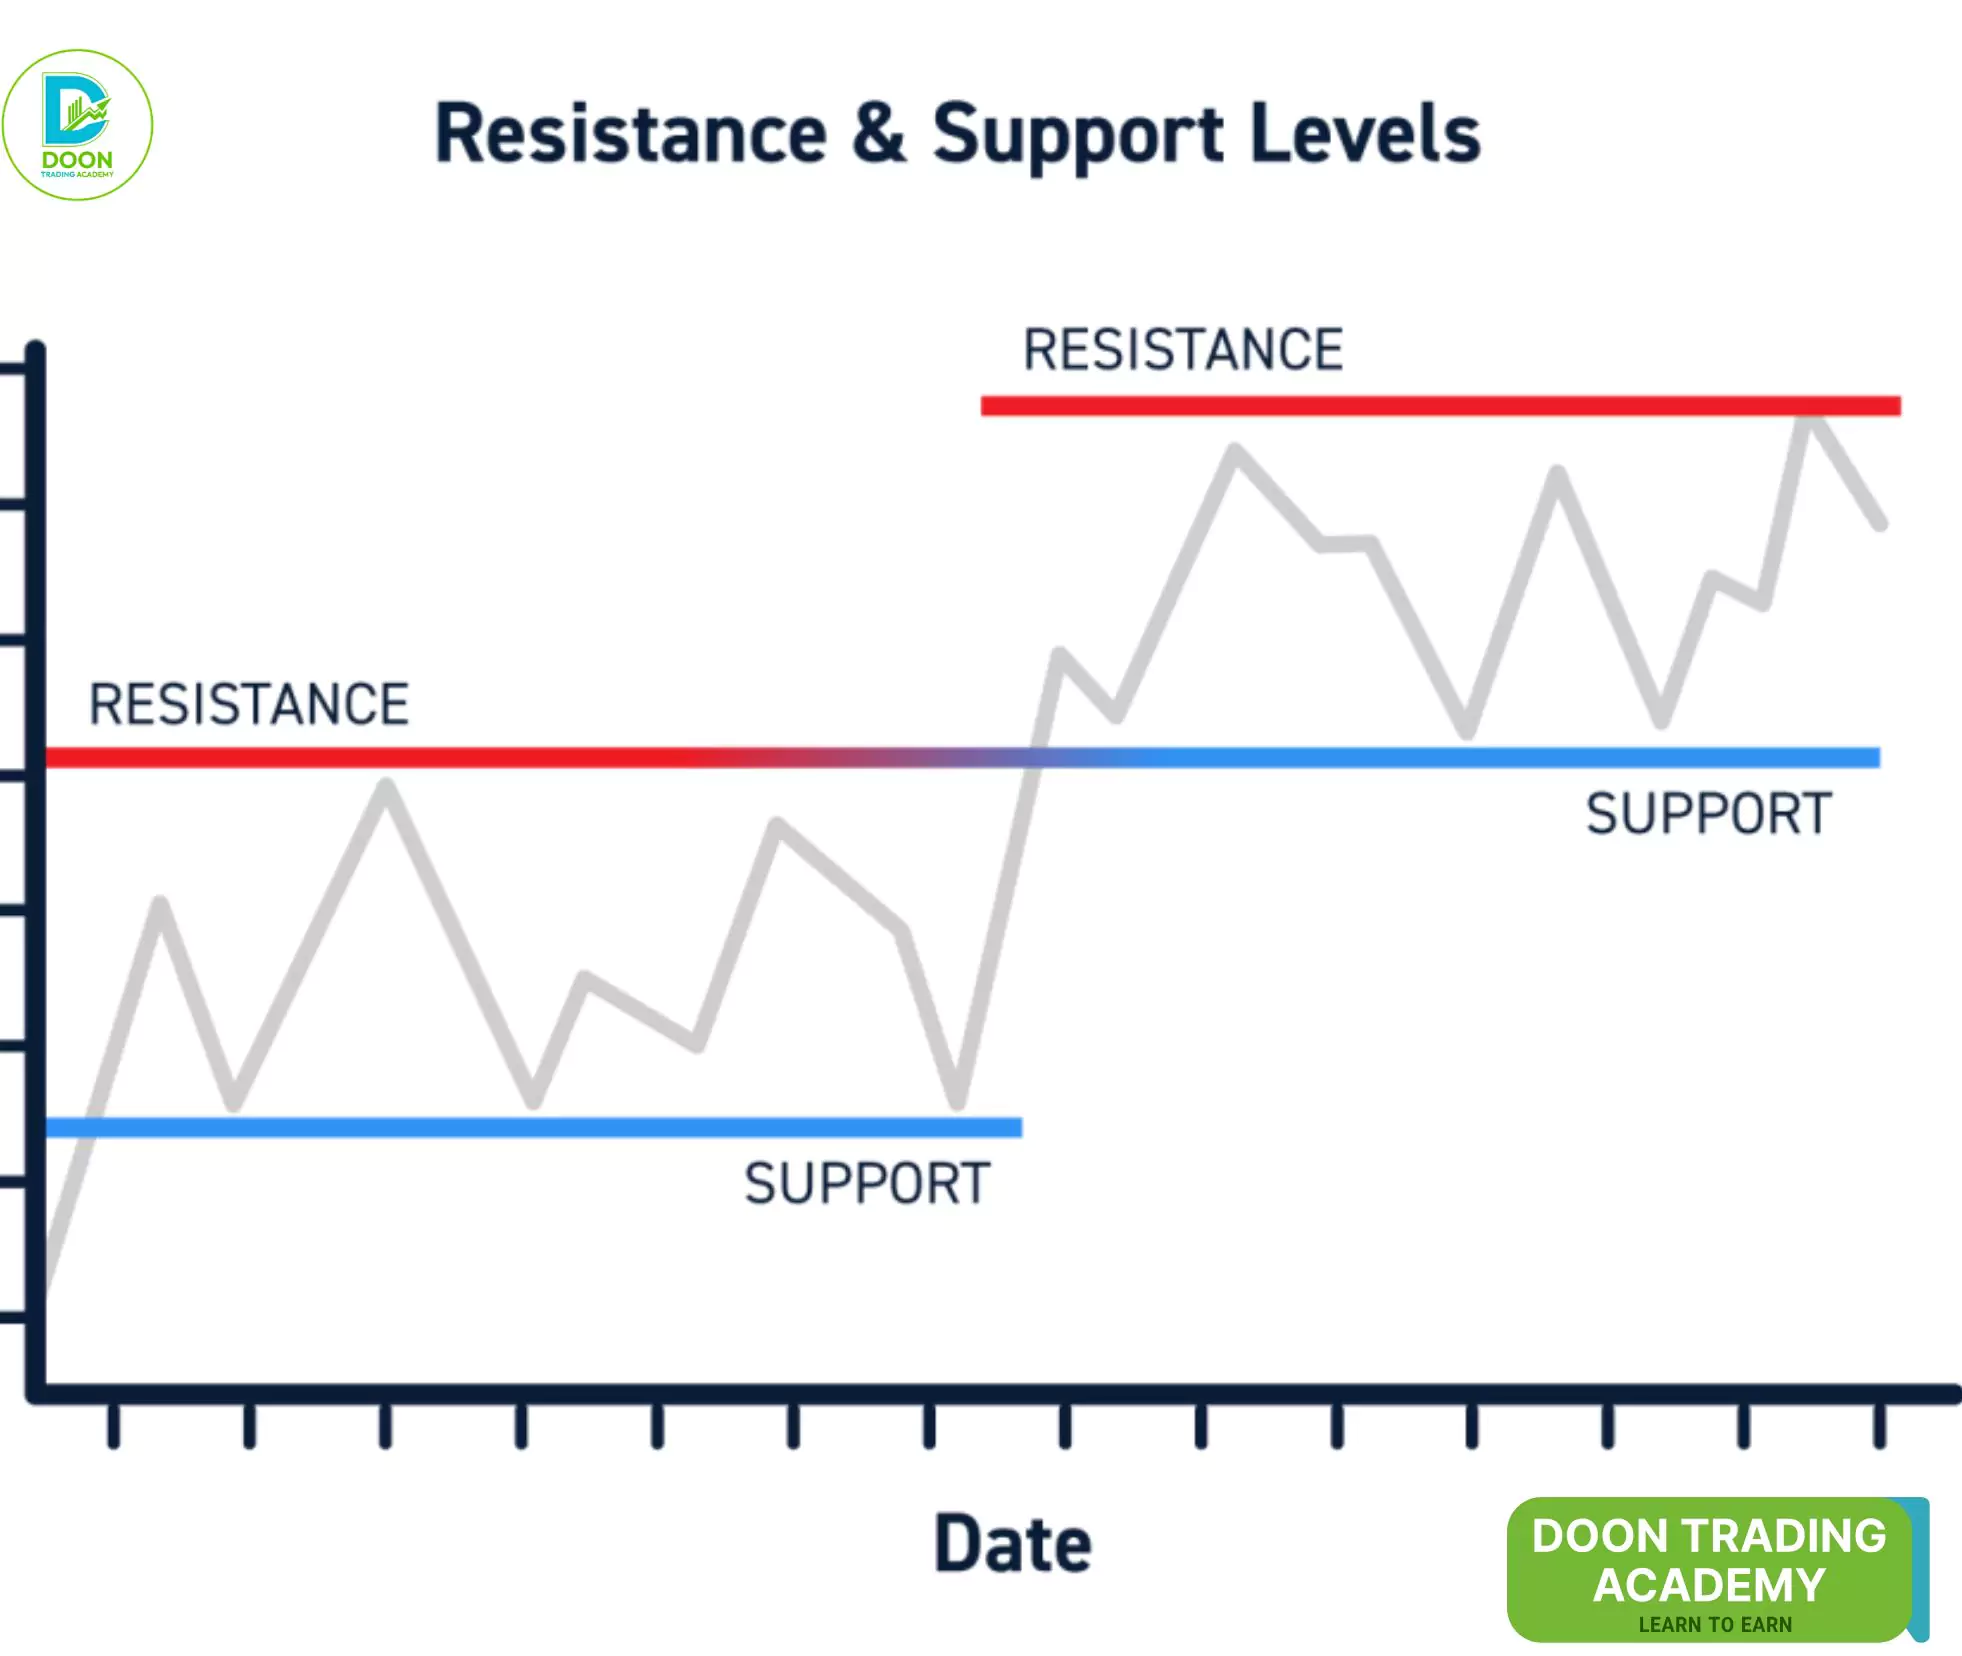
Experienced traders emphasize that these are best seen as zones, not precise lines. Patterns that form at these levels carry extra weight. When strong patterns coincide with support or resistance, especially on higher timeframes, reliability increases. As shared by vibrantwave on StockTwits: “I stopped looking for patterns in isolation; S/R zones tell me where the real action happens.”
Table: Pattern Comparison and Reliability
| Pattern | Approximate Success Rate (Real-World) |
|---|---|
| Head and Shoulders | 60–70% |
| Double Tops/Bottoms | 45–70% |
| Triangles (Ascending/Descending) | 60–80%* |
| Cup and Handle | 61–95% (bull markets) |
| Flags/Pennants | 66–75% |
| Support/Resistance | Highly context-dependent |
*Higher rates in trending markets; much lower in choppy or algorithm-driven environments.
Tips for Beginners
- Start with only 1–2 patterns at a time. Master their identification and nuances before moving on.
- Always confirm with volume—breakouts on low volume are more likely to fail.
- Use higher timeframe charts for spotting major patterns and lower timeframes for fine-tuning entries and exits.
- Implement strict risk management; risk no more than 1–2% of your capital on any trade.
- Track your trades in a journal to review what works and adapt as you gain experience.
- Never trade a pattern without considering overall market trend and economic context.
- Backtest and paper trade before risking real money. Familiarity with how patterns behave in different markets is crucial.
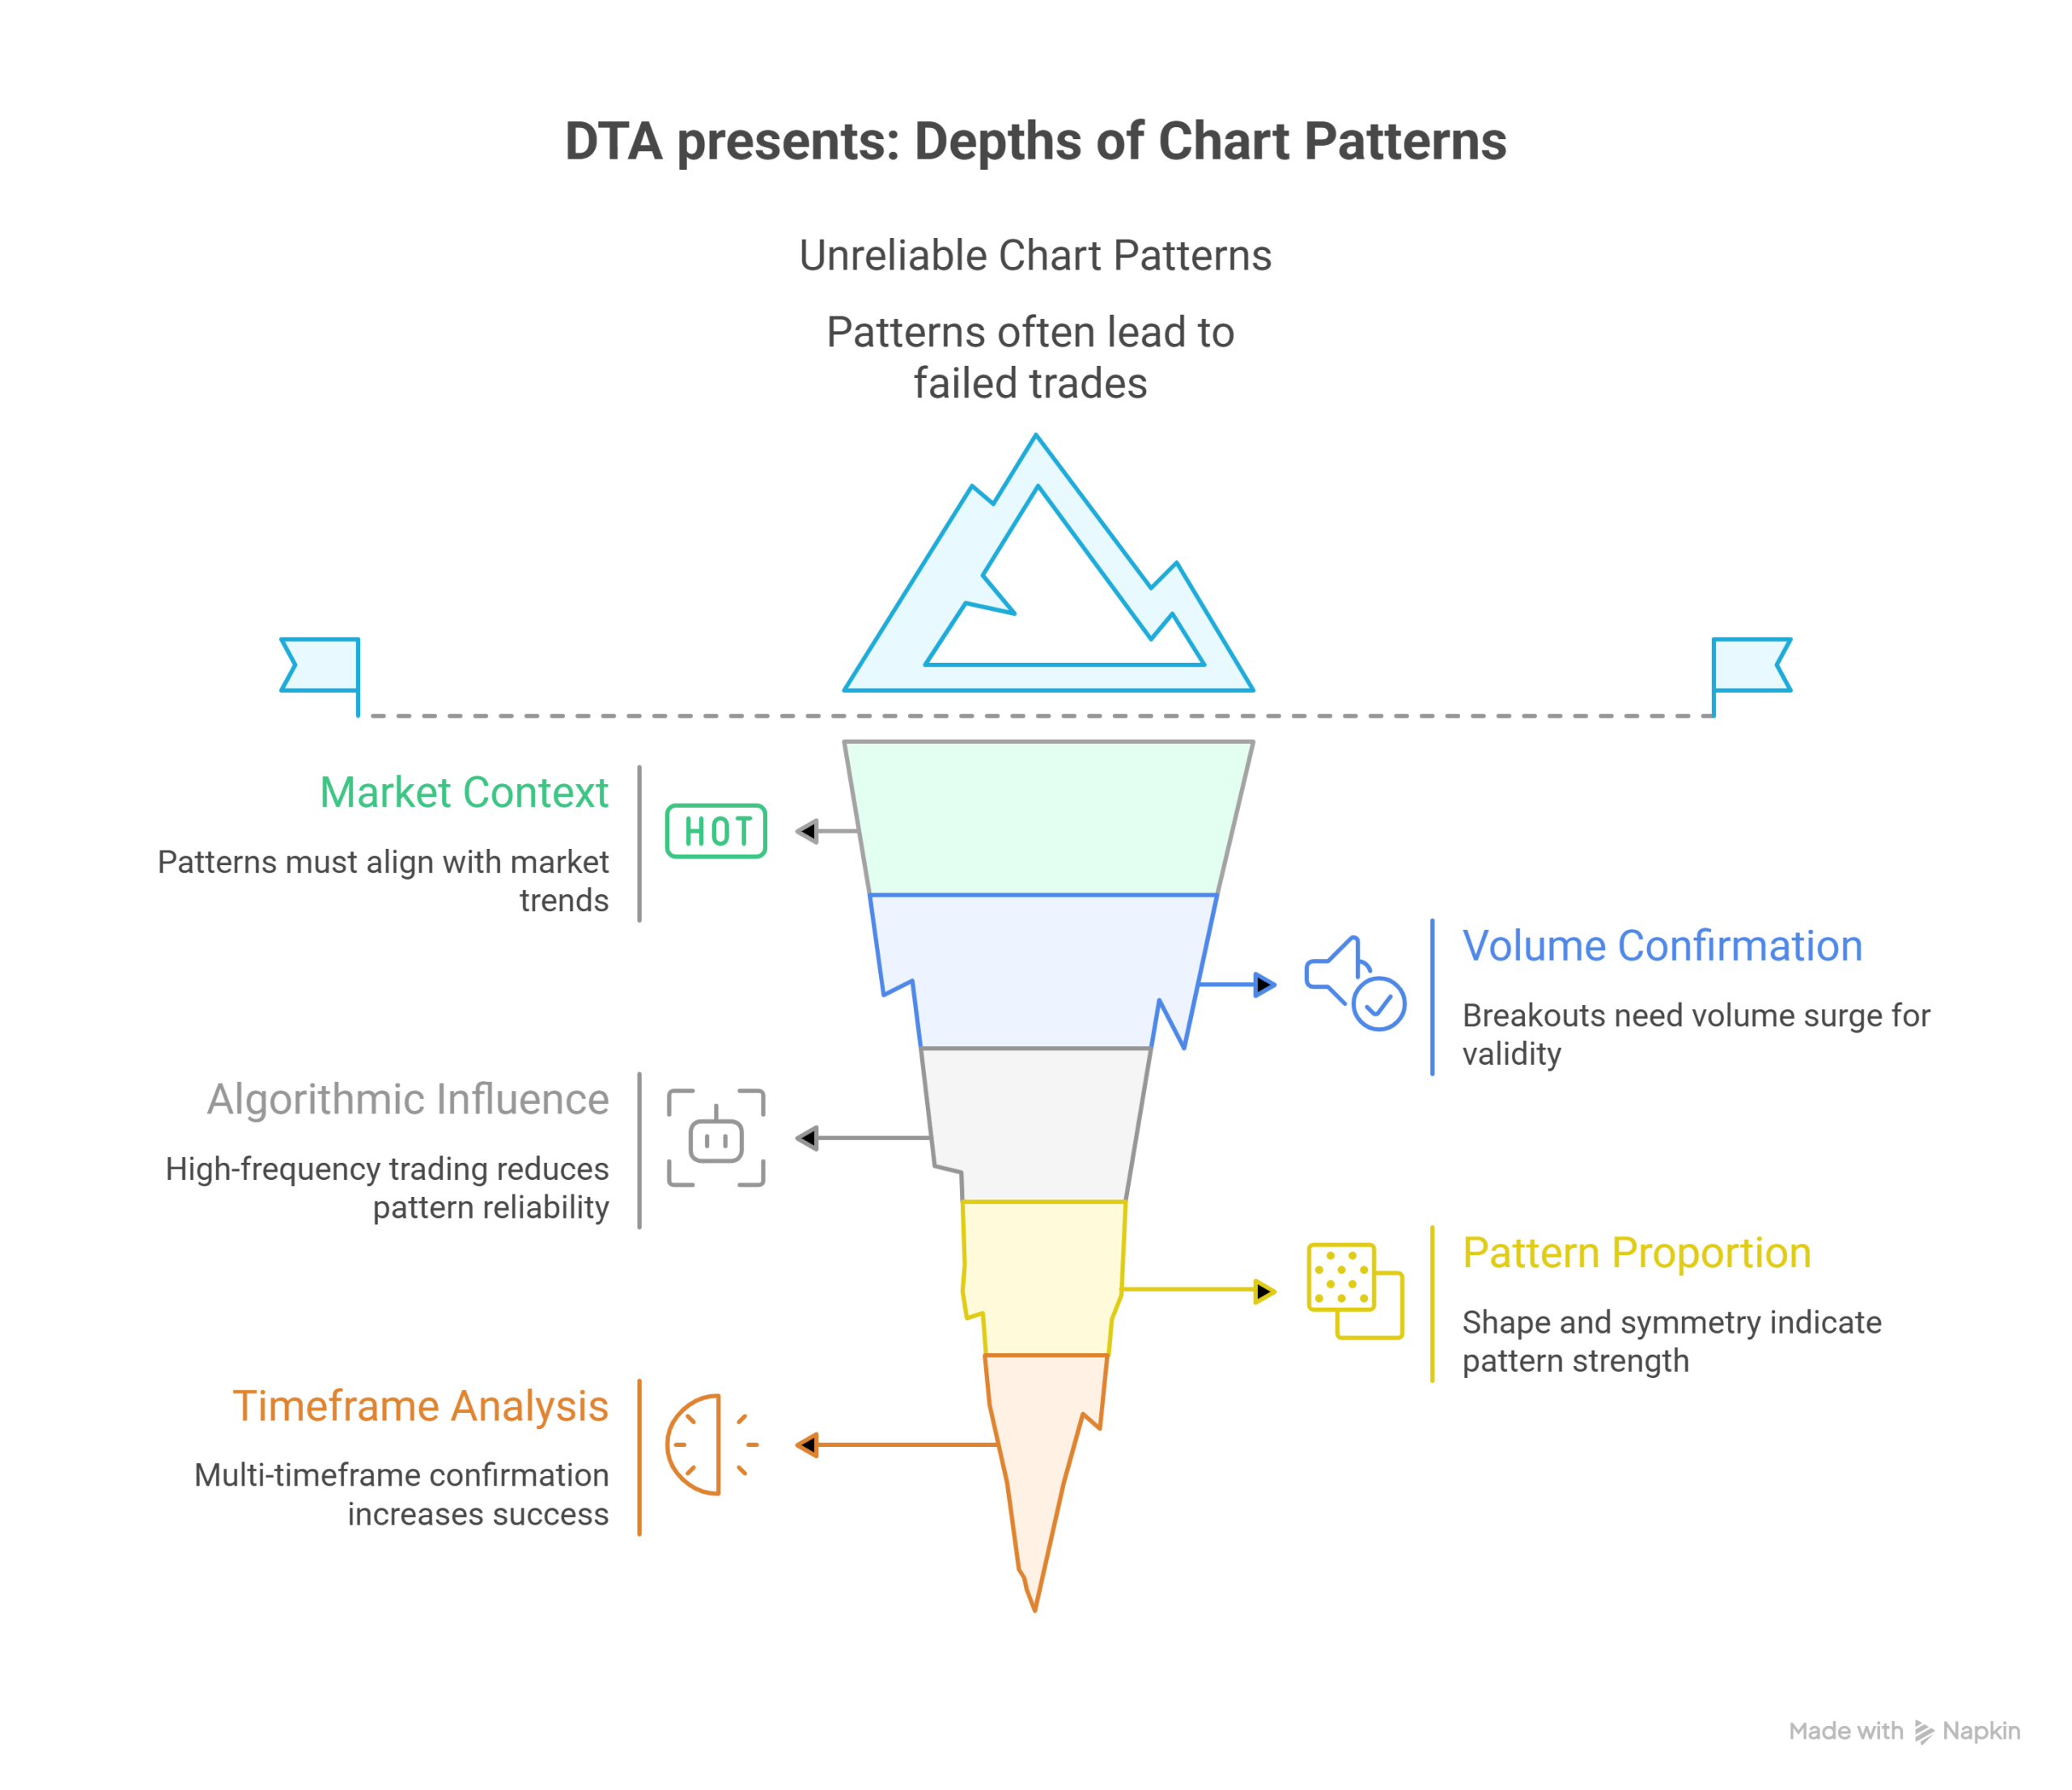
5 Beyond-Common-Sense Facts About Chart Patterns
- Context trumps pattern: Patterns that align with the prevailing trend and overall market structure are more reliable than standalone formations—even the best pattern fails in strong counter-trends.
- Volume is the “lie detector” for chart patterns: Breakouts lacking a volume surge often result in failed trades and stop outs.
- Modern markets have eroded traditional pattern reliability: Success rates for classic patterns have declined since the 1990s due to increased algorithmic and high-frequency trading.
- Pattern proportion matters: The shape, symmetry, and proportion of a pattern often signal its strength—sloppy, uneven formations are more likely to fail.
- Multiple timeframe analysis unlocks pattern power: Spotting the same pattern across daily and weekly charts dramatically increases its probability of success.
Additional Resources
- TradingView’s chart pattern community streams
- BabyPips’ complete guide to chart patterns
- Bulkowski’s Encyclopedia of Chart Patterns
- LuxAlgo pattern performance statistics
- Best beginner charting platforms like TradingView and StockCharts
Conclusion
When I was starting out, I was drawn to the promise of chart patterns—and in time, I realized that while they can offer powerful insights, there’s no such thing as a “guaranteed” setup. Patterns serve as a tool to help me understand group psychology, time my trades, and set reasonable targets or stops, but only when I apply them with discipline and context.
Here’s a recap of how to approach chart reading, step by step:
- Begin by understanding chart basics—axes, timeframe selection, candlesticks, and volume.
- Choose 1–2 easy patterns (like double tops/bottoms or flags) and get comfortable spotting them.
- Focus on pattern formation at major support and resistance zones—these setups have the best odds.
- Always require volume confirmation before taking breakouts seriously.
- Keep risk low and manage trades with pre-planned stops; journal your progress.
- Use demo accounts to practice without risking real money until you’re comfortable.
- Continue learning—study resources, backtest your strategies, and listen to those with more experience.
If you’re just starting your chart pattern journey, remember: expertise comes with time and review. Share your experiences, questions, or favorite patterns in the comments—I’d love to hear how you apply these techniques or what you’d like to explore next!