


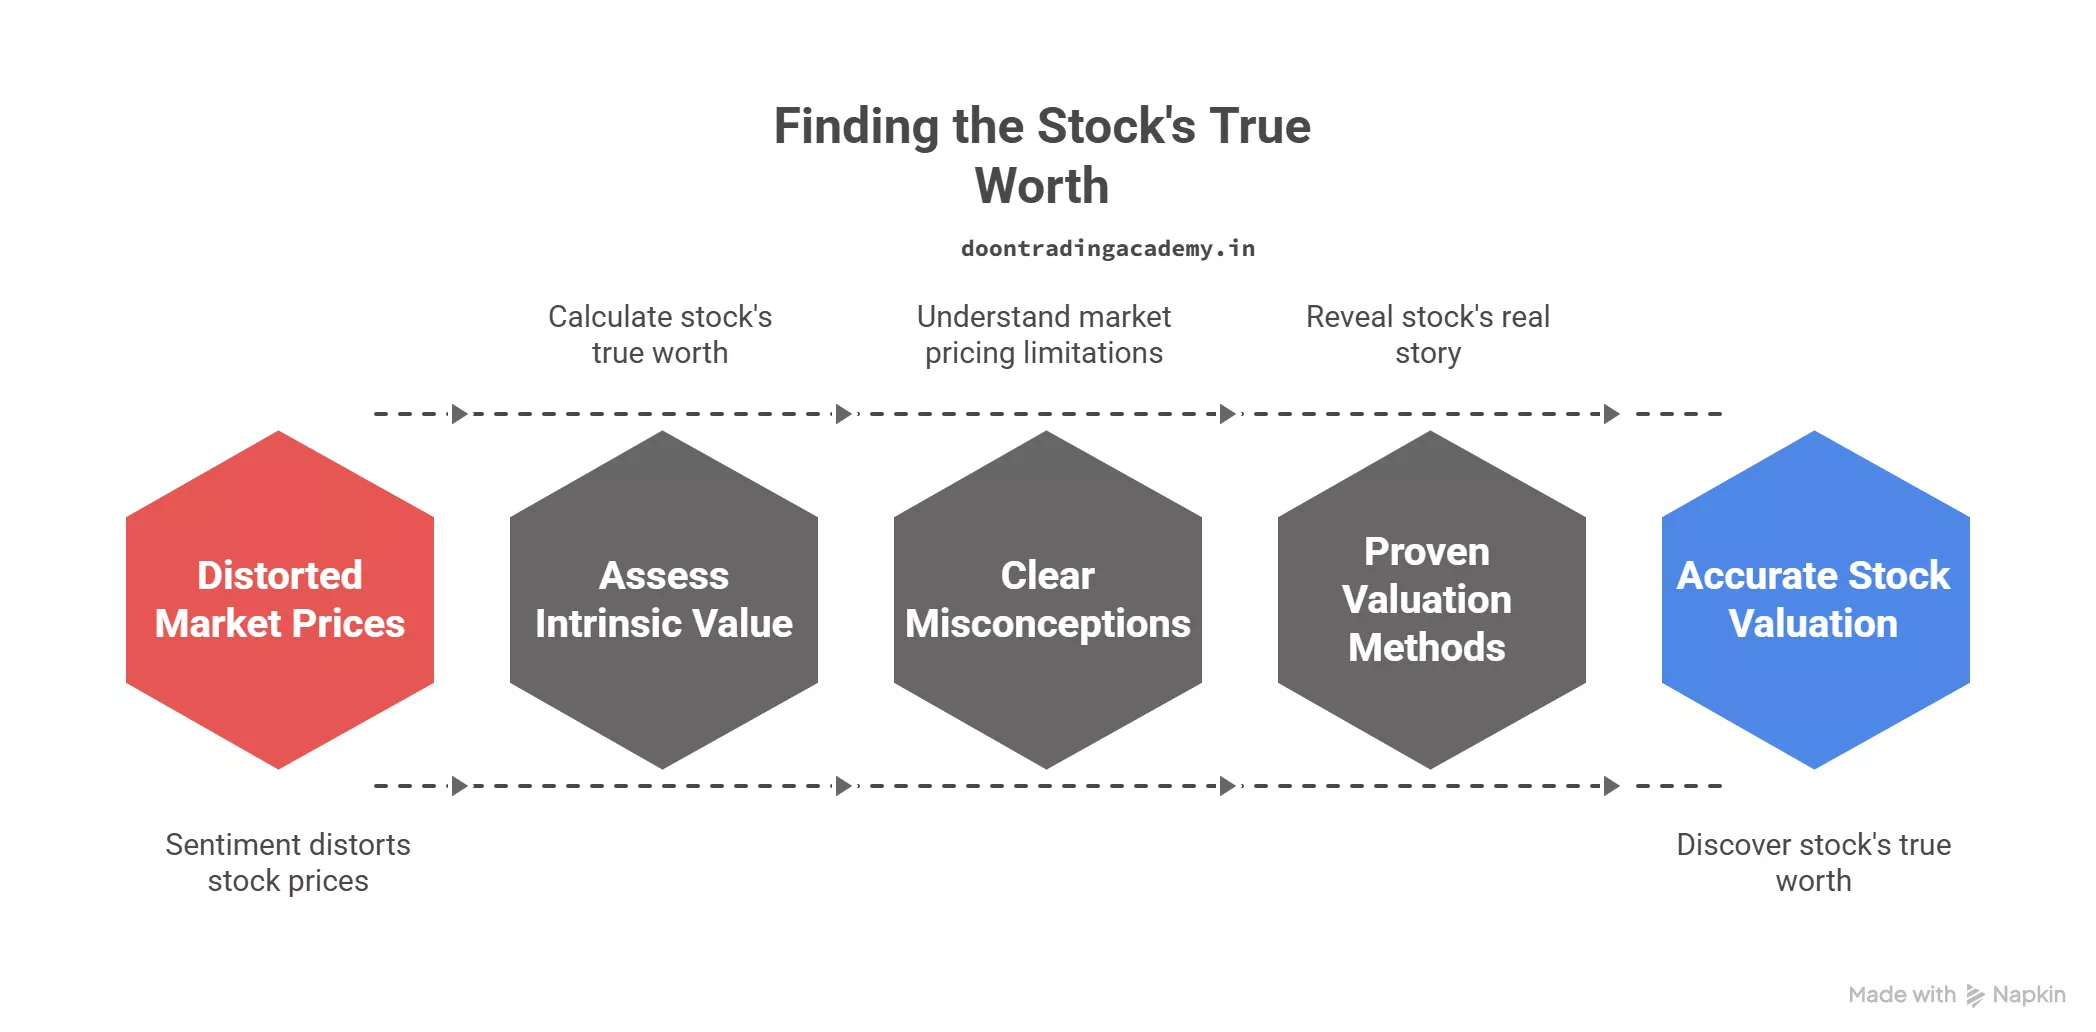
Accurately calculating intrinsic value is the heart of value investing—and in my experience, it’s the most reliable way to cut through market noise and discover a stock’s true worth. Many investors assume that market price always mirrors underlying value. Yet, as I often see, short-term sentiment, speculation, and emotional swings frequently distort prices, leaving genuine opportunities for those who focus on fundamentals. In this article, I’ll share the most effective ways I’ve learned to assess intrinsic value, clear up common misconceptions about market pricing, and walk through the four proven valuation methods that reveal the real story behind any stock.
Quick Summary
- Intrinsic value is the true worth of a stock based on fundamentals, often diverging from short-term market price.
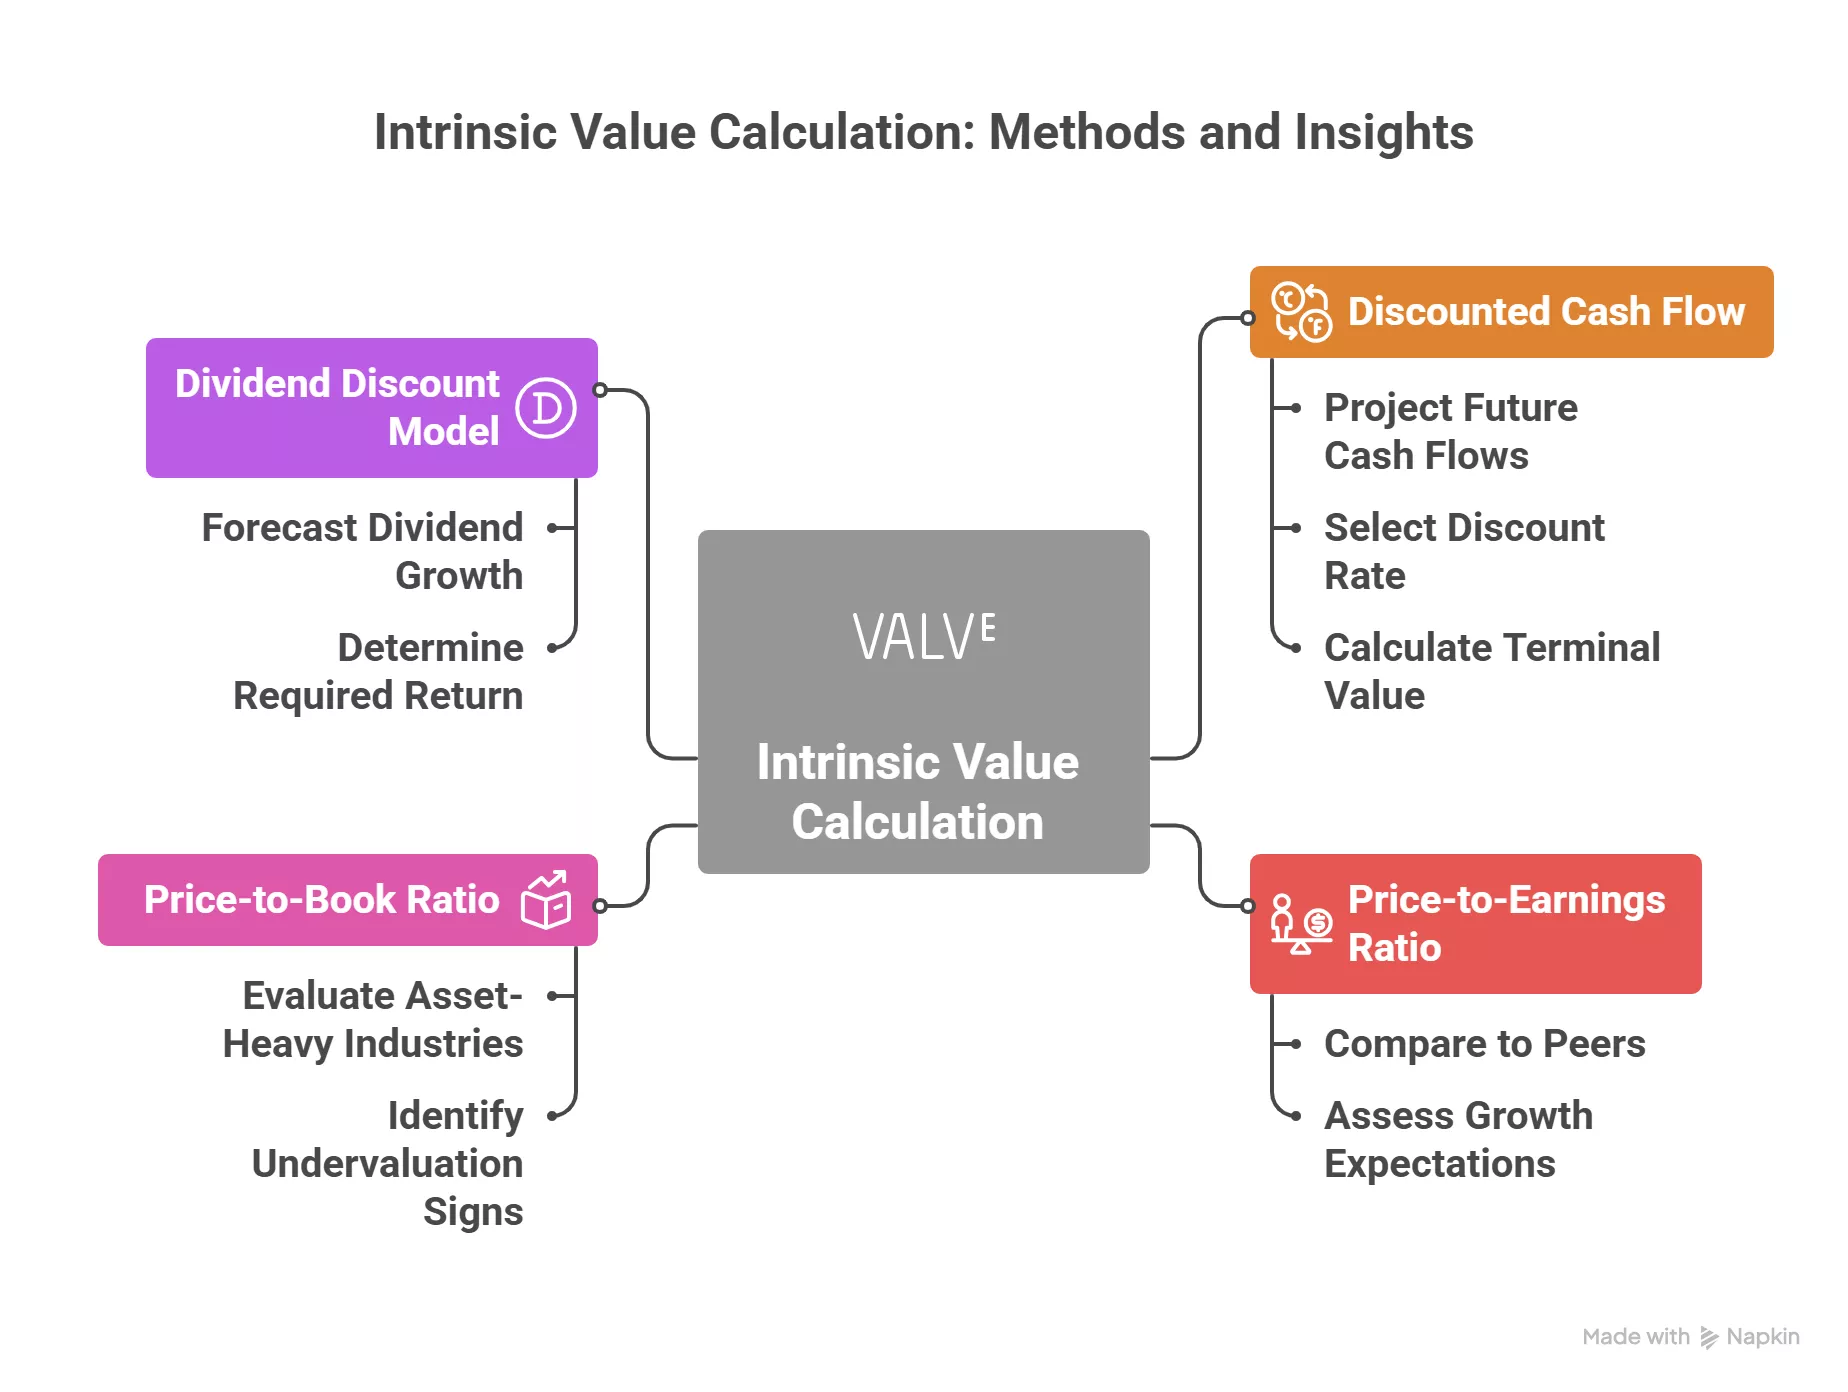
- Four core methods—Discounted Cash Flow (DCF), Price-to-Earnings (P/E) Ratio, Price-to-Book (P/B) Ratio, and Dividend Discount Model (DDM)—provide robust frameworks for intrinsic value calculation.
- Valuation is as much an art as a science: all methods involve assumptions that affect outcomes.
- Margin of safety—buying below intrinsic value—protects investors from unavoidable errors or market surprises.
- Combining multiple methods gives the most reliable estimate of a stock’s true worth.
Understanding Intrinsic Value
Intrinsic value is the underlying true worth of a stock, calculated using objective financial analysis rather than relying on the market’s prevailing mood. It’s what a business is really worth if you strip away hype, headlines, and speculation. The importance of intrinsic value lies in its ability to help investors spot mispriced assets. Market price often reflects only current sentiment or macro trends, while intrinsic value projects the business’s actual earnings power and assets.
Crucially, intrinsic value can differ—sometimes wildly—from market value. This gap emerges not only due to changing investor sentiment but also because many market participants act on emotion or herd behavior. As Warren Buffett famously put it, “Price is what you pay, value is what you get.” Every investor encounters situations where a high-quality business falls out of favor, sending its stock price far below what the fundamentals justify, or where the opposite happens—hype sends share prices to unsustainable heights.
A range of factors shape a company’s intrinsic value including revenue growth, profit margins, debt, return on equity, management quality, economic conditions, and intangible factors like brand strength or intellectual property. High-performing companies with durable competitive advantages (“moats”) and solid management typically boast higher intrinsic values than their less stable peers. Likewise, shifts in the broader economy—interest rates, inflation, regulation, and sector trends—can significantly impact a stock’s underlying worth.
Discounted Cash Flow (DCF) Analysis
The Discounted Cash Flow (DCF) model is often considered the gold standard for intrinsic value analysis. I personally find it the most powerful, especially for established firms with predictable cash flows. The DCF method is built on a simple principle: a business is worth the sum of all future cash it will produce, discounted back to present value.
DCF Step-by-Step Process
- Project future free cash flows. Analyze past financials to estimate revenue growth, margins, and capital needs for 5–10 years ahead.
- Select a discount rate. Use the company’s weighted average cost of capital (WACC) or cost of equity, reflecting its riskiness and the opportunity cost of capital. For most large companies, this is between 8–12%.
- Calculate terminal value. Estimate the business’s value beyond the forecast period using either the perpetual growth model (often 2–3%) or an appropriate industry exit multiple.
- Discount all cash flows to present value. Each future year’s cash flow is discounted using the formula: PV = CF / (1 + r)n.
- Add together the present values of the forecast and terminal periods. This total gives you the enterprise value. Subtract debt and add back excess cash to get intrinsic equity value.
The DCF shines because it’s grounded in the fundamental economics of the business. It doesn’t care about current market sentiment—it cares about how much cash the company will generate. However, its biggest challenge is sensitivity: the final valuation can swing wildly depending on small changes in assumptions, particularly the terminal growth rate or discount rate. That’s why I always run sensitivity analyses to see how the value shifts under different scenarios.
Limitations? Absolutely. It’s not well-suited for early-stage companies with highly uncertain cash flows. And one Reddit user, u/hdizzle, rightly points out: “DCF is only as good as your assumptions. Garbage in, garbage out.” I couldn’t agree more.
Price-to-Earnings (P/E) Ratio
The Price-to-Earnings (P/E) ratio is a classic, quick-and-dirty tool I use to gauge whether a stock is overpriced or cheap relative to its earnings. It’s calculated simply: P/E = Share Price / Earnings Per Share (EPS).
What does the P/E show? A high P/E usually means investors expect strong future growth; a low P/E can indicate undervaluation or, sometimes, market pessimism about future prospects. Comparing the P/E of a stock to its industry peers or its own historical average can offer insight into whether it’s fairly valued. For instance, a mature utility trading at 10x earnings could be cheap if similar companies trade at 15x, while a tech company at 50x earnings might seem expensive—unless it’s growing much faster than peers.
Where the P/E excels is simplicity: “It’s a great starting point,” as Redditor u/SeeingStripes puts it, “but don’t rely on it alone—it tells you nothing about the balance sheet or capital structure.” The ratio is often misleading for companies with temporary earnings spikes or cyclical businesses. It can also punish firms with lumpy or depressed net income due to one-off items, even if cash flow is strong. I also supplement it with the PEG ratio (P/E divided by earnings growth rate) for a growth-adjusted lens.
- P/E best for stable, mature companies.
- P/E is less useful for firms with volatile or negative earnings.
Example: If Stock A trades at a 12 P/E and peers average 18, it could be undervalued—if quality and outlook are similar.
Price-to-Book (P/B) Ratio
The Price-to-Book (P/B) ratio compares a company’s stock price with its book value (assets minus liabilities). The formula is P/B = Share Price / Book Value per Share. When I’m evaluating banks, insurers, or asset-heavy businesses, I find P/B an especially valuable check.
A P/B under 1 can suggest the stock trades for less than the net worth of its tangible assets—a possible sign of undervaluation, especially if assets are marked conservatively. However, I always look closer: sometimes persistent low P/B signals deeper problems, like structural decline or hidden liabilities. For tech companies or businesses with big intangible assets, P/B often misleads, as book value misses valuable IP or brand strength.
- P/B is best for financials and asset-rich industries.
- Less relevant for service, tech, or brand-driven firms.
One Frequently Asked Questions (FAQ) gem from the Bogleheads forum captures it: “P/B highlights value traps—sometimes the cheap ones are cheap for a reason.” That’s always in my mind as I analyze.
| When to Use P/B | Limitations |
|---|---|
| Banks, insurers, REITs, manufacturers | Ignores intangible assets, not useful for tech/services |
| Gauging deep book value discounts | Easy to miss hidden risks in ‘cheap’ stocks |
Dividend Discount Model (DDM)
As a dividend-focused investor at heart, I appreciate the Dividend Discount Model (DDM) for valuing companies that grow and pay out regular dividends. The DDM posits that the value of a stock equals the present value of all future expected dividends. The basic Gordon Growth Model formula is: P = D1 / (r – g), where D1 is next year’s dividend, r is the required return, and g is growth rate.
I use the DDM for mature companies with stable, predictable dividend growth (think utilities, consumer staples, and big telecoms). It’s less helpful for firms that reinvest heavily and pay no or erratic dividends. Also, forecasting long-term dividend growth accurately is tough—assumptions about rates can swing the results radically.
DDM’s strengths:
- Directly links investor returns to actual payout policy
- Ideal for income stocks, REITs, and dividend aristocrats
Challenges:
- Not applicable for firms that don’t pay steady dividends
- Very sensitive to growth and required return estimates
On Seeking Alpha, user DividendInvestor2021 puts it bluntly: “If management isn’t committed to sustained payouts, DDM’s just guesswork.”
Advanced Valuation Insights: Comparing Methods and Avoiding Pitfalls
No valuation method is universally perfect—all carry specific strengths and risks. I always triangulate from multiple methods for a “sanity check.” DCF is thorough but assumption-sensitive; P/E and P/B are quick but risk missing the big picture; DDM nails dividend stocks but is useless for non-payers. The key is to use each tool where it shines, cross-check the results, and be wary of the common traps.
- Bullish case for integrated analysis: Combining DCF with P/E and P/B often highlights gaps—especially in cyclical markets or when “story stocks” catch fire and outpace fundamentals.
- Sensitivity matters: Tweaking inputs can swing outcomes dramatically, especially in DCF and DDM.
- Margin of safety is non-negotiable: I only buy when the current price is well below my most conservative intrinsic value estimate.
Table: DCF vs. P/E vs. P/B vs. DDM
| Valuation Method | Best For |
|---|---|
| DCF | Predictable, mature businesses with reliable cash flows |
| P/E | Stable, established companies in non-cyclical industries |
| P/B | Asset-heavy sectors like banks/REITs |
| DDM | Dividend stalwarts with consistent growth |
Real-World Application: Reddit’s Stock Price vs. Intrinsic Value
Reddit’s IPO offered a teaching moment in intrinsic value calculation. Shares soared from $34 to $225, then fell to $113, showing a massive disconnect between hype-driven market prices and steady business fundamentals. Wall Street analysts were split—Morgan Stanley and J.P. Morgan called fair value near $45, while others argued for over $100 based on growth. Alpha Spread calculated an intrinsic value of $70.07, while The Investors Podcast gave a $100–110 range, each using different DCF and growth projections.
Why such wild differences? Assumptions. Optimists modeled aggressive revenue/user expansion and higher future margins, while skeptics knocked back projections because of competitive risks and user churn. As a Redditor, u/firetom, quipped: “If you think Reddit is the next TikTok, maybe $225 makes sense. If not, buckle up.”
For me, this case illustrates the necessity of conservative modeling, margin of safety, and constant skepticism when market prices go parabolic. No matter how exciting the growth story, the numbers (and risks) always win out in the long run.
Common Pitfalls and Troubleshooting
Over time, I’ve run into—or made—every mistake in the valuation handbook. Here’s how I spot and avoid them today:
- Overly aggressive growth and margin projections: Small tweaks in these assumptions can drastically inflate intrinsic value, especially in the DCF model. Stick to realistic, evidence-backed estimates and check industry averages for sanity.
- Ignoring the quality of assets in P/B analysis: Not all book value is equal—outdated or overvalued assets can turn “cheap” stocks into value traps.
- Neglecting the company’s cash position and debt: Always adjust for excess cash and net out debt to find true equity value.
- Using the wrong discount rate: If the rate doesn’t match the business risk, results will mislead. For small, risky firms, use a higher rate; for blue chips, a lower, market-based rate usually suffices.
- Not running sensitivity analysis: I religiously test how my valuation shifts when key inputs (growth, discount rate) move up or down.
In my own portfolio, I once undervalued the impact of a small change in terminal growth rates on a DCF—missing that a drop from 3% to 2% slashed my fair value estimate by 15%. Lesson learned: always “stress test” your math before acting.
Margin of Safety and Risk Management
I never make recommendations—or buy for myself—without a clear margin of safety. It’s your buffer against the unpredictable: management changes, unexpected competitors, or black-swan events. Benjamin Graham considered it the most important principle of value investing. Charlie Munger summarized it best: “It’s better to be roughly right than precisely wrong.” If I calculate a stock’s intrinsic value at $100 and it trades at $60, that built-in discount gives room for error and peace of mind.
Risk management doesn’t stop with valuation. I diversify, avoid overconcentration, and regularly revisit my assumptions when business conditions evolve. And I accept that not every stock will perform—losses are inevitable, but the margin of safety keeps them manageable.
Five Advanced Insights Beyond Common Sense
- Intrinsic value isn’t a single number—it’s a range. All calculations reflect shades of uncertainty and require humility.
- Terminal value can account for more than 70% of a DCF result for growth businesses; overreliance on this step makes accuracy crucial.
- Market inefficiencies (herding, panic, irrational exuberance) frequently create price/value gaps ripe for exploitation by disciplined valuation.
- Combining DCF with relative valuation exposes mispricings unseen by using only one method—this approach is standard among institutional investors.
- Behavioural biases, not just math errors, often drive mispricing—overconfidence in growth projections or herd panic can blind even “smart money.”
References and Further Reading
- The Intelligent Investor by Benjamin Graham (definitive value investing guide)
- Investopedia: Intrinsic Value Explained
- Alpha Spread’s Reddit Intrinsic Value Analysis
- Rational Walk: Graham’s Intrinsic Value Formula
- Bogleheads Forum: Valuation Discussions
- Finbox: Intrinsic Value Formula Deep-Dive
I also recommend online courses from the University of Michigan’s Valuation Course and Investor’s Business Daily Learning Center.
Conclusion
In my investing journey, embracing intrinsic value calculation has been my greatest advantage. While market prices can be fickle, cold, rational analysis anchored in fundamentals consistently brings clarity and conviction to every decision I make. To recap, here’s how you can apply what we’ve discussed:
- Start by defining intrinsic value based on fundamentals, not market price.
- Apply multiple valuation methods—DCF, P/E, P/B, DDM—choosing the most suitable for the company type.
- Be rigorous but conservative with your assumptions; always run sensitivity scenarios.
- Cross-check your results against peers and historical norms.
- Insist on a margin of safety before risking your capital.
- Keep learning and adapting as companies, industries, and markets evolve.
I invite you to share your experiences, insights, or intrinsic value calculations in the comments below. Have you spotted a disconnect between price and value in your stock analysis? Let’s discuss and learn together.
Remember: mastering intrinsic value isn’t just about finding bargains—it’s about protecting your wealth and achieving lasting investment success.