

If you’ve ever checked the day’s financial news in India, chances are you’ve seen the Sensex and Nifty mentioned in every headline. As a market participant, I’ve learned that these two benchmarks aren’t just numbers; they represent the pulse of India’s economic confidence, investor mood, and global relevance. Understanding what they signify—and how just a handful of leading stocks can sway their direction—is crucial for any investor seeking to navigate India’s capital markets effectively.
Quick summary
- Sensex and Nifty are India’s primary stock market indices representing the top 30 and 50 companies, respectively.
- Both indices use free-float market capitalization to calculate their values, giving more influence to larger, publicly traded companies.
- Index movements are disproportionately affected by a handful of leading stocks, often in the financial, IT, and energy sectors.
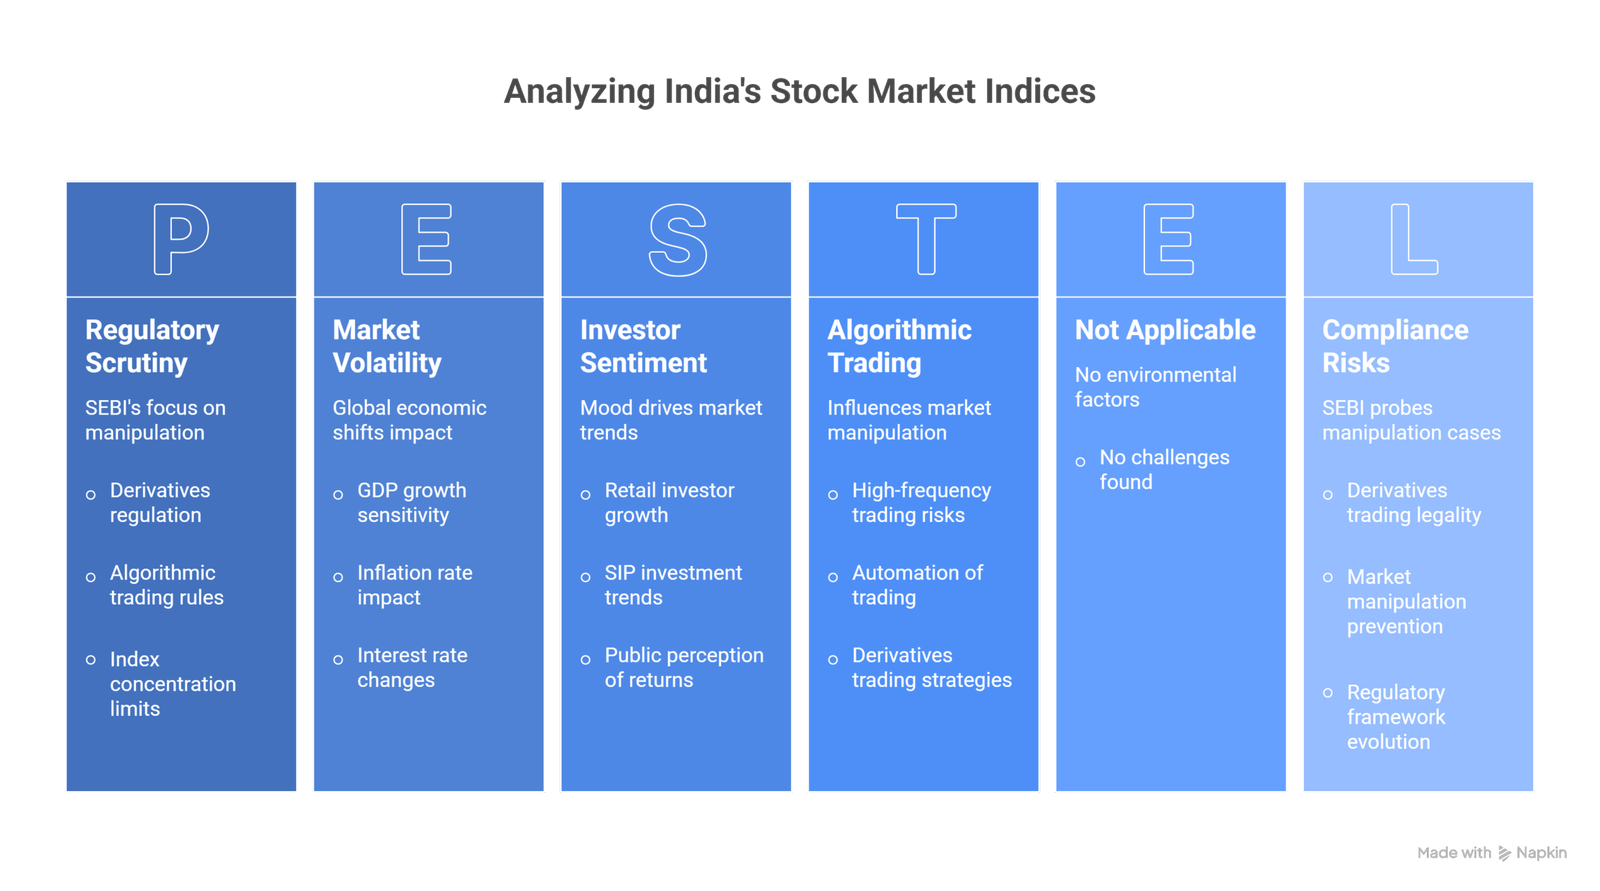
- Recent developments reveal regulatory concerns around derivatives, concentration risk, and market manipulation by global trading firms.
- Most retail investment vehicles (like SIPs and mutual funds) are highly exposed to these index constituents, impacting wealth creation and risk profiles.
Understanding Stock Market Indices
Stock market indices are statistical measures that track the performance of a selection of publicly traded companies. They serve as benchmarks, helping investors and analysts gauge the broader market’s health and spot trends at a glance. Indices distill vast amounts of trading activity into a single, comprehensible figure, allowing comparison across time and between markets globally.
Their purpose extends beyond simply providing a real-time snapshot of market value. Indices such as the Sensex and Nifty are used for passive investment strategies, tracking portfolio performance, constructing derivative products (like futures and options), and making informed business or policy decisions. When the Nifty or Sensex moves, it often triggers action across the broader financial system—from institutional rebalancing to everyday retail investors adjusting their SIP allocations.
Sensex and Nifty – An Overview
India’s financial markets revolve around two flagship indices: the BSE Sensex and the NSE Nifty 50. The Sensex, or Sensitive Index, was introduced in 1986 and covers 30 major companies spanning key sectors of the Bombay Stock Exchange. The Nifty 50, launched in 1996, hikes that scope to the top 50 companies on the National Stock Exchange, offering a wider representation of India’s corporate landscape.
Both indices have become synonymous with India’s economic growth story. Policymakers, financial planners, and global investors look to these indices as real-world proxies for the country’s business optimism, regulatory climate, and sectoral momentum. Recent performance shows that both Sensex and Nifty remain sensitive to internal reforms and global shifts; in 2025, the Nifty hovered near the 24,894 mark amid fluctuating global macroeconomic signals and domestic reforms.
Composition of Sensex and Nifty
Inclusion in Sensex or Nifty is no minor feat. Companies must clear certain hurdles—primarily market capitalization, sector representation, liquidity (measured by trading volume), and corporate governance standards. The focus remains on companies that truly reflect India’s economic activity, so there’s ongoing rebalancing and reviews by the stock exchanges’ index committees.
The Nifty 50, for example, heavily features banking (20.69% weight), information technology (12.2%), and oil/energy (10.86%) stocks. This means shocks or booms in these sectors can ripple across the entire index, amplifying both gains and losses for investors involved in index-linked instruments or funds. Notably, recent mutual fund data highlights that HDFC Bank, ICICI Bank, and Infosys are among the most widely held stocks, with more than 700 domestic mutual fund schemes invested in each.
Role of Leading Stocks in Driving Markets
‘Leading stocks’—those with the largest free-float market capitalizations and liquidity—can command immense sway over the indices. These are often household names: Reliance Industries, HDFC Bank, TCS, ICICI Bank, Infosys, and Bharti Airtel.
Their characteristics? Consistent earnings, sectoral dominance, high trading activity, and robust governance track records. Because of their outsized index weight, a major move (positive or negative) by just one of these giants can send the entire market up or down for the day. As of October 2025, Reliance Industries alone contributed 9.31% of the total Nifty 50 weight, followed closely by HDFC Bank at 7.48% and Bharti Airtel at 5.83%.
That’s why days of high volatility, especially when triggered by new policies or global events, often see these stocks at the center of attention. For instance, when TCS lost ₹97,598 crore in value in a single week this year, both Sensex and Nifty suffered sharp declines—affecting the cumulative wealth of retail and institutional investors.
How the Top 50 Stocks Impact Sensex and Nifty
Both Sensex and Nifty are calculated using free-float market capitalization weighting. In other words, the index value is derived from the aggregate market value of all constituent stocks, multiplied by the free-float factor (the shares available for public trading)—not the total outstanding shares.
This approach ensures that only the actively traded, publicly available portion of a company influences index swings. It prevents stocks with large promoter or government holdings but thin trading float from unfairly skewing the index.
The effect? Companies with higher free-float market caps have a markedly higher impact. For example, if Reliance’s share price drops 3% in a session, its larger index weight means the overall Nifty could fall significantly—even if several smaller constituents rise that day. The reverse is equally true. This mechanism magnifies concentration risk—where, as of 2025, the top 10 Nifty stocks alone make up over 60% of the index’s weight.
Economic Indicators and Market Sentiment
The Sensex and Nifty frequently mirror the broader economic sentiment—both domestic and global. Factors such as GDP growth, inflation, interest rates, and regulatory changes are immediately reflected in index movements, as the companies included are sensitive to these macro drivers. When central banks raise rates or government implements new regulations, you’ll see the effect almost instantaneously on these indices.
Investor mood—or market sentiment—is another decisive force. A single news flash about technology regulation or US-India trade can spark a domino effect of buying or selling, especially from large institutional or foreign investors. For instance, recent rupee depreciation and increased US tariffs on Indian pharmaceutical exports saw relevant sectoral stocks—and thus the indices—experience steeper declines.
It’s often said in market circles: “The index doesn’t just reflect economic reality; it shapes it.”
Analyzing Trends and Making Informed Decisions
In my experience, monitoring Sensex and Nifty trends is pivotal for both long-term investors and short-term traders. Investors use moving averages (like the 20-day or 200-day lines), momentum oscillators, and chart support/resistance levels to spot market cycles and make decisions.
For example, as per technical analysts, a breach below the Sensex’s ₹82,600 support level in September 2025 indicated near-term weakness, prompting professional and retail traders to adjust their portfolios. Moreover, Reddit user ThrowawayInvestor133 observed: “I invested ₹10,000 every month in SIPs for 20 years… Inflation-adjusted, that money’s worth about ₹28 lakh today. The ‘wealth creation’ story is more complicated than the ads say!” This quote underlines the importance of examining both nominal returns and real (purchasing power-adjusted) outcomes.
For investors, this means:
- Always view index returns in real, inflation-adjusted terms.
- Understand sectoral and concentration risks within index funds or SIPs.
- Monitor global developments, as cross-border influences now impact Indian indices more than ever.
Stock Market Indices Sensex and Nifty: Beyond-Common-Sense Insights
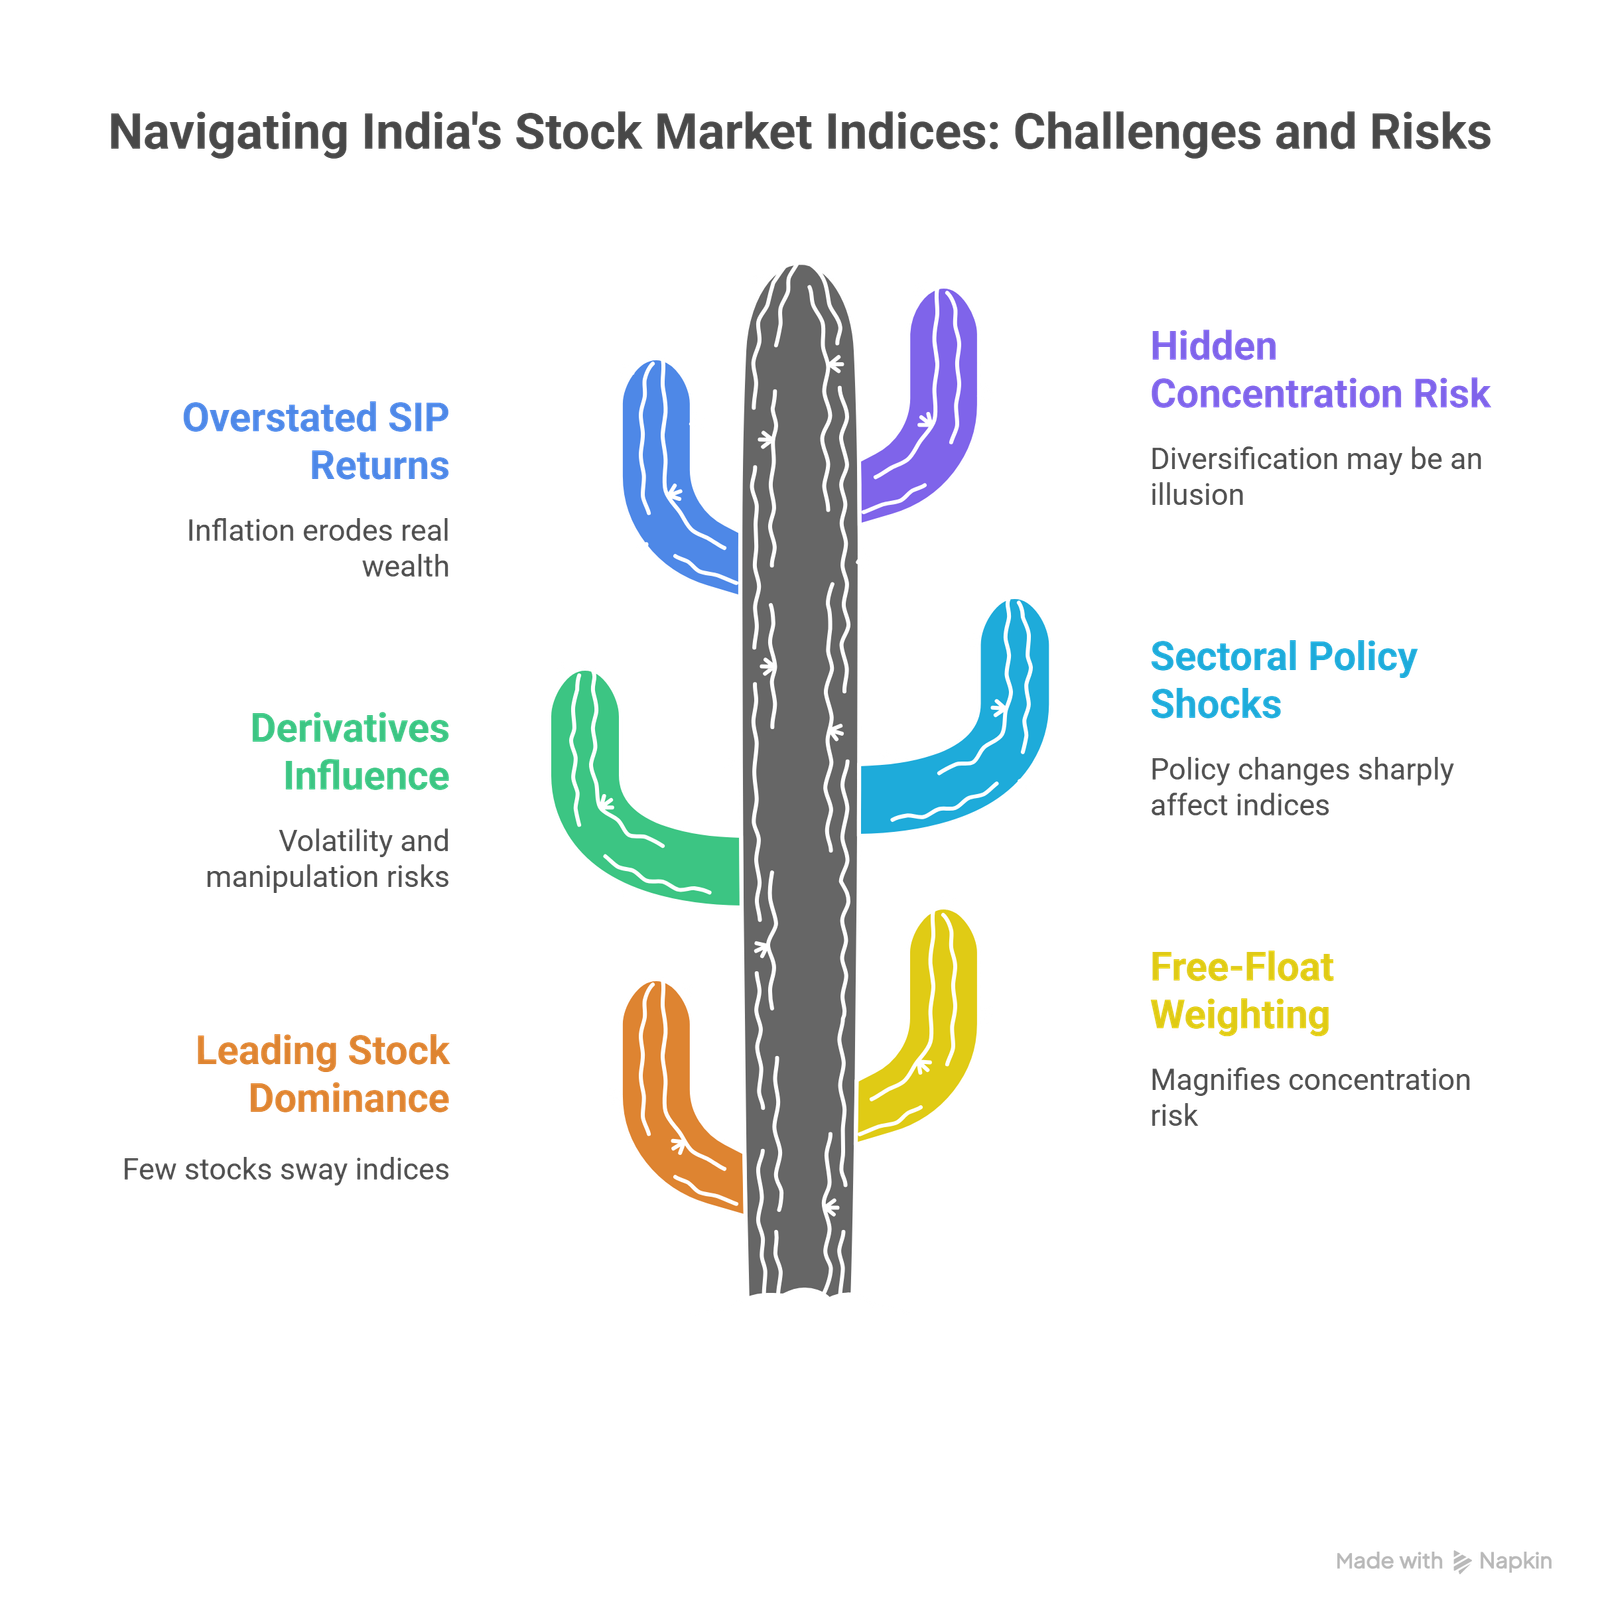
- Derivative Volumes Dominate Underlying Trades: On high-volatility days, the notional value traded in Bank Nifty options has been more than 350 times that of the underlying stocks, introducing volatility and opportunities for sophisticated trading strategies.
- Concentration Risk Is Hidden: Over 700 mutual fund schemes holding the same handful of top index constituents means that “diversification” in fund portfolios may be an illusion, especially for retail investors.
- Market Manipulation Feasibility: Cases like Jane Street’s, where aggressive trading in select index stocks was used to steer the index for derivatives gains, show that even globally regulated markets can be influenced by strategic trades.
- Sectoral Policy Shock Effects: A single policy tweak (such as the US increasing H-1B visa fees or tightening pharma imports) can sharply affect index levels due to sectoral concentration.
- SIP Returns Often Overstated: According to heated Reddit debates, after adjusting for inflation, even “high” 12% SIP returns over two decades can result in surprisingly modest real wealth accumulation (“₹92 lakh looks good on paper, but it’s worth less than a third after inflation!” – u/InvestRightIndia).
Table: Sensex vs. Nifty 50 – Key Comparison
| Sensex (BSE) | Nifty 50 (NSE) |
| 30 constituents, mostly large-cap blue chips | 50 constituents, broader sectoral coverage |
| Older index (est. 1986); iconic market status | Established 1996; foundation for futures/options |
| Sector-heavy in banking, IT, energy | More diversified, but still concentrated at top |
| Used as an economic health barometer | Base for majority of passive investment vehicles |
Case Study: The Jane Street Market Manipulation Incident
In January 2024, Jane Street—a global quantitative trading firm—was investigated by SEBI for allegedly manipulating Bank Nifty’s closing price. By aggressively buying and selling select stocks within a tight window, they were able to nudge the index in their favor, pocketing hundreds of crores through strategic options positions while taking controlled losses elsewhere.
This case exemplified the risks from high derivatives activity and index concentration. As described on Reddit by u/MarketWatcherIndia: “SEBI freezing ₹4,800 crore in assets sends a message—index derivatives offer big profits but big headaches for market stability, too.”
Regulatory Evolution and the Future of Indian Indices
SEBI’s renewed focus on index concentration, derivatives growth, and market manipulation is prompting potential structural reforms. Possible actions include capping the maximum weight of any stock in indices with active derivatives, reducing the frequency of weekly options expiry, and tightening algorithmic trading rules.
This is crucial, as more Indian households than ever participate in the market via passive mutual funds and ETFs linked to these indices. The objective? Protect ordinary investors from risks introduced by over-concentration and speculative derivative volumes—a challenge not unique to India, but accentuated by its rapid retail investor base growth and world-leading derivatives trade volumes.
Conclusion
In my experience, truly grasping how Sensex and Nifty function goes beyond watching headline numbers or investing in index funds on auto-pilot. Understanding the dominance of leading stocks, the real implications of free-float weighting, and the rise in derivatives-driven market shifts has made me a more cautious and informed investor.
If I had to summarize the process step-by-step:
- Start by learning what indices are and why they matter.
- Examine how Sensex and Nifty are composed and calculated, especially the free-float market cap method.
- Recognize key sectors and the outsized role of a few companies in driving index moves.
- Analyze both short- and long-term trends with technical and fundamental tools.
- Factor in external (global) risks and regulatory changes that may add hidden risks or opportunities.
- Stay updated on regulatory reforms and industry cases that could influence index structure and market stability.
Ultimately, investing in India’s stock market—whether directly or through SIPs—requires ongoing education and a willingness to question apparent ‘truths’ about diversification, returns, and risk. Have you had your own experience with index fund investing, SIPs, or market volatility? I’d love to hear your stories or questions in the comments below—let’s continue the conversation and help each other become smarter investors!
References
- Zerodha Varsity: “How is the Nifty Index calculated?”
- Moneycontrol. “Nifty 50, Sensex: Technical Analysis and Recent Trends.”
- NSE India. “Methodology and Calculation of Indices.”
- Economic Times. “Top Nifty stocks and sectoral distribution.”
- Reddit /r/IndianStockMarket – “SIP Debate” and “Jane Street SEBI Case” discussions.
- Business Standard. “Top mutual fund holdings in Nifty companies.”
- Mint. “SEBI probes market manipulation cases.”
- Bloomberg. “India’s derivatives market: Global comparison and challenges.”
- Financial Express. “SEBI’s regulatory changes for index derivatives.”