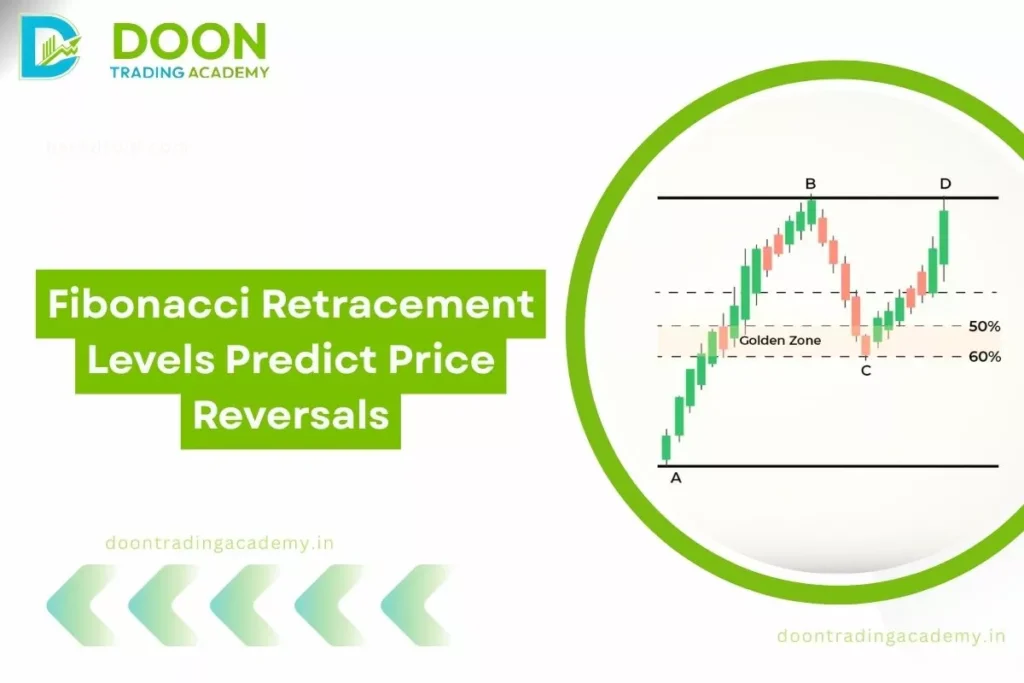



I started studying technical analysis because charts felt like a shortcut to understanding markets. Over several years of studying indicators, backtesting strategies, and trading ., I found recurring flaws that students rarely discuss in class. This article explains those limitations honestly so you can judge when chart-based methods are helpful and when they become misleading.
- Quick summary
- Technical analysis can be misled by noisy data, overfitting, and changing market regimes.
- Backtests that ignore transaction costs, slippage, and survivorship bias produce overly optimistic results.
- Indicators are derivatives of price and often lag; they do not create predictive power by themselves.
- Human behavior and institutional order flow can invalidate simple pattern rules.
- Robust strategy design requires out-of-sample testing, realistic execution assumptions, and active risk management.
Core reasons technical analysis fails
1. Noise and low signal-to-noise ratio

Price series contain a lot of random fluctuations. Many chart patterns and indicators respond to that noise, producing false signals. A pattern that looks convincing on one timescale can be meaningless on another.
Students often mistake frequent signals for predictive accuracy instead of recognizing that most short-term movements are stochastic.
2. Overfitting and data-snooping
When you tune parameters to maximize historical performance, you risk fitting idiosyncrasies of past data rather than uncovering a real relationship. Overfit rules crumble in . trading because they captured noise, not a durable mechanism.
Backtests without parameter stability checks or walk-forward validation usually overstate edge and fail in new market conditions.
3. Look-ahead bias and survivorship bias
Many textbook examples and naive backtests peek into future information or drop delisted securities, artificially inflating results. Real-world testing must use only information available at the decision time and include delisted/failed instruments to be realistic.
4. Execution friction: slippage, spreads, and liquidity
Charts ignore practical costs. Small-cap assets, thin markets, and fast intraday strategies pay large implicit costs that transform apparent profits into losses. Ignoring these frictions is a common reason strategies look great on paper but fail in practice.
5. Changing market regimes and nonstationarity
Markets evolve: regulation, technology, macro regimes, and participant composition change over time. A rule that worked during one regime may break when volatility structure, liquidity, or dominant participants change. Technical analysis often assumes stationarity that doesn’t exist.
6. Confirmation bias and narrative fallacy
Humans are pattern-seeking. Traders remember hits and forget misses, and they overlay stories on random outcomes. This cognitive bias fuels belief in chart patterns that are actually chance occurrences.
Technical limitations explained
Indicators lag and compound lag
Most indicators are mathematical transforms of past prices, so they inherently lag. Combining several indicators often compounds lag instead of improving entry timing. That delay reduces real-world profitability, especially for short holding periods.
Non-uniqueness of patterns
The same price action can be interpreted differently by different traders. What one person sees as a breakout another calls a false signal. The subjective nature of pattern recognition reduces reproducibility and makes reliable automation difficult.
Sample size and low-frequency events
Many patterns are rare. Evaluating their effectiveness on a few historical occurrences produces unreliable conclusions. Large sample sizes and cross-market tests are necessary but often lacking in student projects.
Two-column comparison
| Common technical analysis assumption | Reality and limitation |
| Patterns repeat reliably | Patterns are context-dependent and can change with market regime |
| Historical backtest reflects future performance | Backtests often ignore costs, biases, and overfitting risk |
| Indicators give early warning | Most indicators lag and can create delayed or false signals |
| Visual chart inspection is sufficient | Subjectivity leads to poor reproducibility and selection bias |
Real-world remarks from traders
On forums, the same frustrations recur. One comment I saw summarized it well: u/TradeLearner wrote, “My backtest was 80% profitable — until I simulated spreads and slippage; suddenly the edge disappeared.”
Another common thread: u/ChartSkeptic observed, “I followed a bullish pattern for months and lost money because institutional flow reversed sentiment overnight.” These viewpoints illustrate how practical issues derail theoretical winning setups.
Advanced insights: five beyond-common-sense facts
- Short-.d microstructure effects can create apparent signals that vanish once execution volume increases; algorithms arbitrage those micro inefficiencies away quickly.
- Indicator combinations often correlate strongly with volatility regimes; a strategy’s performance may be an indirect bet on volatility rather than directional skill.
- Survivorship bias in widely used datasets (like stock indices) makes long-term trend-following strategies look better than they’d be if delisted firms were included.
- Optimization across non-overlapping markets (cross-validation by market) reveals many ‘edges’ are market-specific and not transferable.
- Simple risk controls (position sizing, stop rules based on volatility) often explain more of real-world success than the original indicator signals themselves.
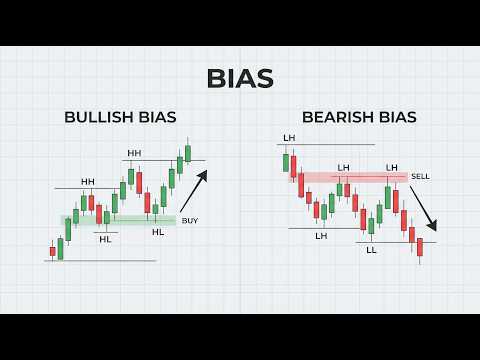
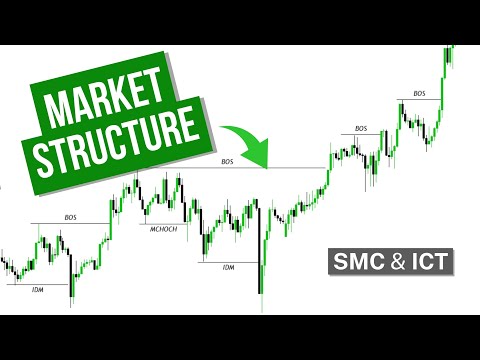
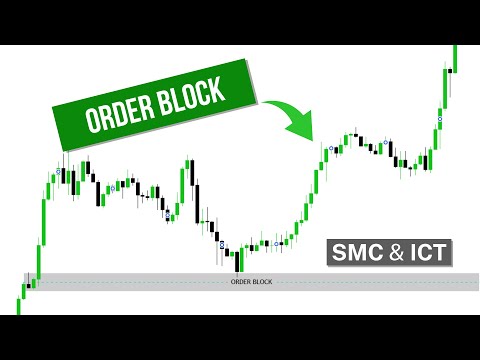
An educational YouTube channel that breaks down Smart Money Concepts (SMC) and ICT-based price action using real chart examples — helping traders build genuine conceptual clarity instead of relying on indicators. Powered by Doon Trading Academy. Educational content only, no trading calls or profit guarantees.
Troubleshooting: what I do when signals fail
I treat failing signals as data, not as reasons to double down. First, I check my backtest for common errors: look-ahead bias, unrealistic fills, and missing costs. A surprising drop in performance usually points to one of those issues.
Next, I test parameter sensitivity. I run walk-forward analysis and Monte Carlo resampling to see if the strategy’s edge is robust across different samples. If a rule only works for a narrow parameter band, I discard it or simplify it.
When . trading underperforms, I reduce position size and add time-based or volatility-based filters. Often the simplest fix is to tighten risk controls rather than tweak indicator logic.
If market regime change is suspected, I pause and re-evaluate with fresh out-of-sample data and shorter lookbacks. Sometimes that reveals a structural shift that demands a different approach or temporary abstention.
Practical checklist for students
- Always include realistic transaction costs and slippage in backtests.
- Use walk-forward validation and out-of-sample testing to avoid overfitting.
- Test strategies across multiple instruments and regimes.
- Monitor robustness: parameter sensitivity, Monte Carlo, and bootstrap methods.
- Prioritize risk management: position sizing, drawdown limits, and stop policies.
Conclusion
I’ve learned that technical analysis is not inherently useless, but it comes with many pitfalls that students underestimate. In my experience, the difference between a broken strategy and a durable edge is rigorous testing, realistic execution assumptions, and disciplined risk management.
Step-by-step, I recommend: verify your backtest for biases and costs, perform out-of-sample and walk-forward validation, test across markets and regimes, examine parameter stability, and implement conservative execution and risk rules. Following these steps turns many fragile chart-based ideas into better-informed hypotheses or shows you when to move on.
If you have experiences, questions, or examples from your own testing, please share them in the comments — I read and respond to thoughtful posts.