



Why Technical Analysis Fails: Limitations Every Student Should Know
I started studying technical analysis because charts felt like a shortcut to understanding markets. Over several years of studying indicators, backtesting strategies, and trading ., I found recurring...

Volume Analysis: What Volume Confirms and What It Doesn’t
I use volume analysis every day to decide whether a price move is likely real or just noise. Volume is one of the few objective pieces of market...

Moving Averages: What They Measure and What They Miss
I use moving averages every day to filter noise and define trend direction, but I also know they can mislead if treated as magical signals. In this article...

RSI, MACD and Momentum Indicators: How They Are Constructed
I study technical indicators daily to improve my trading edge, and understanding how indicators are constructed helped me separate useful signals from noise. In this article I explain...

Multi-Timeframe Analysis (MTA): How & Why Traders Use Multiple Charts
I started using multi-timeframe analysis early in my trading because I kept seeing entries that looked perfect on a 5-minute chart but failed on the daily chart. Over...

Market Structure in Trading: Higher Highs, Lower Lows & Range
I use trend structure—higher highs, lower lows and ranges—as a backbone for my trading decisions. Over time I learned that spotting the swing points and the shift between...
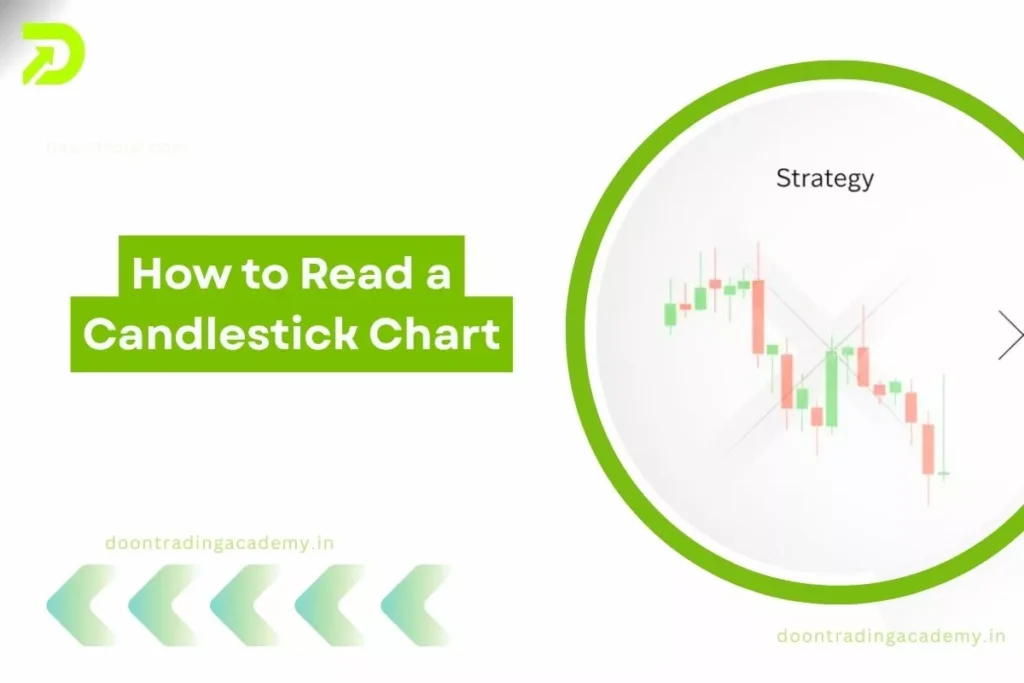
How to Read a Candlestick Chart
I started learning to read candlestick charts because raw price numbers and line charts weren’t giving me the context I needed for trades. Over time I learned to...

Support and Resistance: How Levels Are Identified
I often start my analysis by asking a simple question: where will price likely pause or reverse? Over the years I’ve relied on a combination of price action,...

What Is Technical Analysis? A Beginner’s Framework
I started studying technical analysis because I wanted a repeatable way to read price action and make decisions without relying solely on news. Over time I developed a...

Trading Theory vs. Practice: Why Chart Work Wins
I learned early in my trading journey that charts speak a different language than classroom slides. Theory gives you frameworks and labels; real charts force you to interpret...