



I use trend structure—higher highs, lower lows and ranges—as a backbone for my trading decisions. Over time I learned that spotting the swing points and the shift between trending and ranging behavior is more reliable than chasing indicators that repaint.
In this article I break down how to identify higher highs and lower lows, how ranges form, practical entry and exit rules, and troubleshooting tips from my experience so you can apply the concepts across timeframes.
- Higher highs and lower lows define directional trends; ranges form when that structure breaks down.
- Confirm trend structure across multiple timeframes before risking capital.
- Use price action, support/resistance, and volume context—rather than a single indicator—to confirm moves.
- Entry, stop placement and sizing differ in trends versus ranges; treat them as distinct playbooks.
- Common failures are misreading false breakouts and ignoring hidden liquidity; a simple checklist prevents many mistakes.
Understanding Trend Structure: Higher Highs, Lower Lows and Ranges
Trend structure is the sequence of swing highs and lows that tells you whether the market is trending up, trending down, or stuck in a range. A clear uptrend makes higher highs and higher lows; a downtrend makes lower lows and lower highs. When the sequence fails to produce directional swings, price often consolidates into a range.
Reading structure is about swing identification, context, and the behavior around support and resistance. I rely on simple rules to classify structure so I can switch between trend-following and range strategies without hesitation.
Identifying Higher Highs and Lower Lows
A higher high occurs when the latest swing high exceeds the previous swing high while the corresponding low is also above the prior low (higher low). For a downtrend, the opposite applies: lower low and lower high sequences.
Key practical checks:
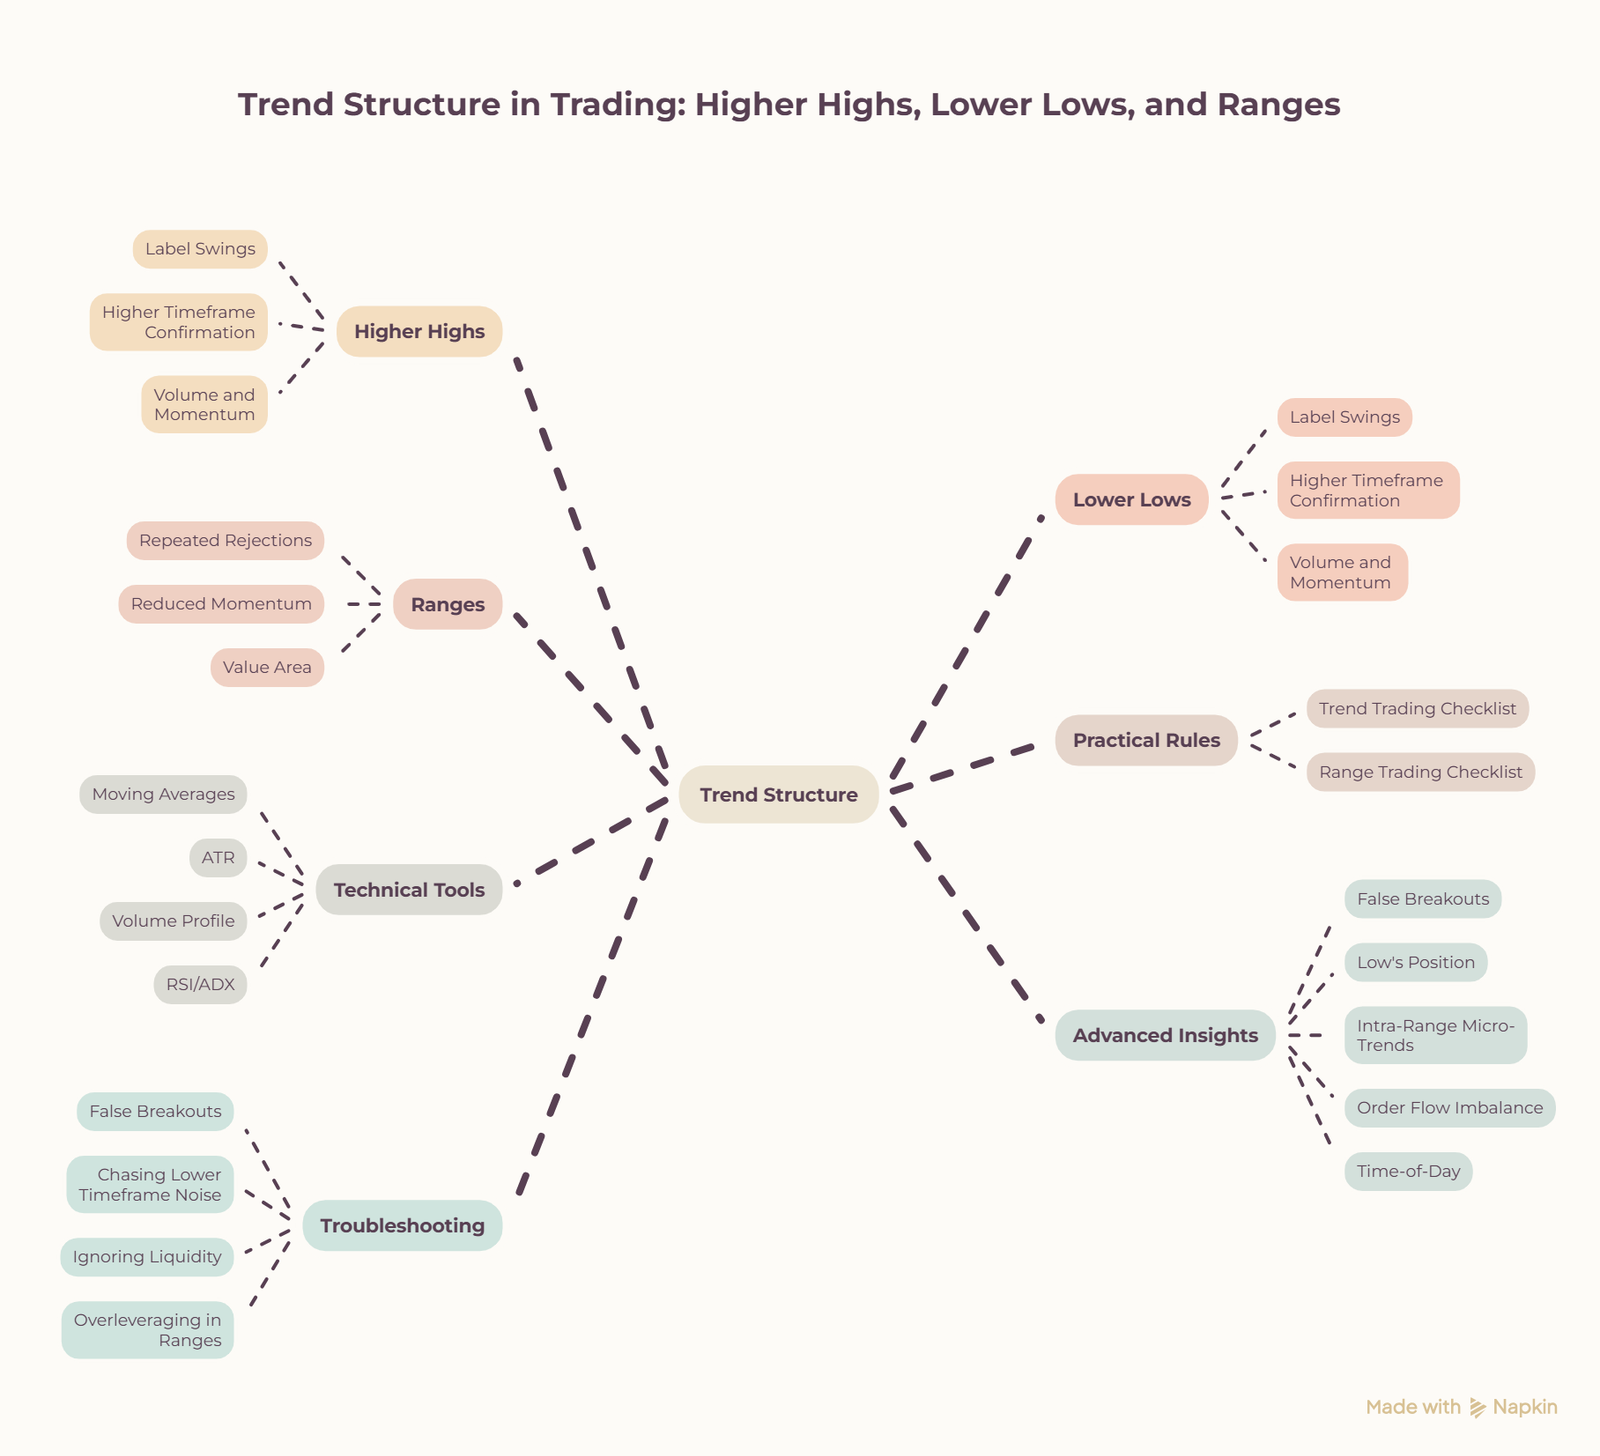
- Label at least three consecutive swings to confirm the sequence (swing high, swing low, swing high).
- Use a higher timeframe to confirm; intraday noise can fake swings on lower timeframes.
- Volume and momentum divergence often precede a break in structure—watch for weakening participation on new highs.
Ranges: How They Form and How to Recognize Them
Ranges form when price fails to make a new high or low and instead oscillates between horizontal support and resistance. This is usually caused by equilibrium between buyers and sellers or lack of directional liquidity.
Signs of a range:
- Repeated rejections at a horizontal level with no clean breakout.
- Reduced momentum on breakout attempts (low volume or quick reversion).
- Price spends more time near the value area with smaller swings compared to trending periods.
Practical Rules and Execution
Apply different rules depending on whether price is trending or ranging. I separate my trade plan into identification, confirmation, entry, stop, and target steps so I don’t mix playbooks mid-trade.

@doontradingacademy on Pinterest
Doon Trading Academy (DTA) is a leading stock market education and mentorship platform based in India, dedicated to transforming aspiring traders into confident, independent market participants through practical, real-world guidance.


Trend Trading Checklist
- Confirm higher highs/higher lows or lower lows/lower highs on the higher timeframe.
- Wait for a pullback to a logical level (previous swing, moving average, or structure support).
- Use a momentum confirming signal (volume spike, bullish engulfing, RSI crossing) for entry.
- Place stops below the last swing low (for longs) or above the last swing high (for shorts).
- Size position so risk per trade matches your risk management plan—typically 1–2% of capital.
Range Trading Checklist
- Identify clear horizontal support and resistance boundaries on multiple timeframes.
- Prefer mean-reversion entries near boundaries with confirmation (candlestick rejection, wick, divergence).
- Keep targets inside the range; avoid holding through likely breakout times (news, session opens).
- Use tighter stops just outside the boundary to limit exposure to breakouts.
Two-column Comparison: Trend vs Range
| Trend | Range |
| Clear sequence of higher highs/higher lows or lower lows/lower highs | Horizontal support and resistance with repeated rejections |
| Use breakout and pullback entries, wider stops, larger targets | Use mean reversion entries, tighter stops, smaller, frequent targets |
| Momentum and volume confirmation important for continuation | Volume often low on failed breakouts; look for reversal signs at boundaries |
| Position sizing can be larger for favorable risk-reward trend setups | Position sizing should account for more whipsaw risk near boundaries |
Technical Tools That Complement Structure
Structure should be the primary signal. These tools add context:
- Moving averages for dynamic support/resistance and trend smoothing.
- ATR for volatility-based stop sizing and target projection.
- Volume profile and order flow to find hidden liquidity and likely breakout zones.
- RSI/ADX for momentum confirmation and trend strength assessment.
Advanced Insights: Five Beyond-Common-Sense Facts
- Not all breakouts equal trend starts: many breakouts are liquidity grabs that reverse to fill stop clusters. The true trend often resumes only after liquidity is consumed and structure realigns.
- Higher highs can form without a reliable uptrend if the corresponding lows are not higher; the low’s position is the decisive element for trend integrity.
- Ranges contain directional information: the slope of intra-range micro-trends and volume distribution can predict which side will eventually break.
- Order flow imbalance near structural pivots often precedes structural breaks—monitoring aggressive buys/sells gives early edge beyond simple price patterns.
- Time-of-day and session transitions materially change structure reliability; a breakout at a major session open carries different probabilities than one in low-liquidity periods.
Troubleshooting: Common Problems and Fixes
I often see traders misclassify structure, then apply the wrong playbook. Here are the problems I ran into and the fixes I use now.
Problem: False Breakouts
Symptoms: Price breaks a level, triggers stops, then reverses sharply. This repeatedly wipes out trades when stops are too tight or entries are naive.
My fix: Wait for a confirmed close beyond the level on the timeframe you trade and check for follow-through volume. If price retests the breakout level and holds, that retest is a cleaner entry with a defined stop.
Problem: Chasing Lower Timeframe Noise
Symptoms: Entering on lower-timeframe “signals” that contradict the higher timeframe structure and getting stopped out by volatility.
My fix: Always align lower-timeframe entries with the higher-timeframe trend or range classification. Use the lower timeframe for precise entries only, not for overriding structure.
Problem: Ignoring Liquidity and Session Context
Symptoms: Trading breakouts during thin liquidity moments and losing to fake moves caused by low participation.
My fix: Avoid initiating breakout trades right before major news or in low-volume sessions. I give weight to moves during the main session and watch order flow near pivot zones.
Problem: Overleveraging in Ranging Markets
Symptoms: Holding large positions through whipsaws inside a range, turning small losses into large drawdowns.
My fix: Reduce position size in ranges and tighten stops. If I suspect a breakout, I prefer a scaled approach: small initial position with add-on only after validated structure change.
Examples and Quick Rules of Thumb
Here are concise, actionable heuristics I use in realtime:
- If the last two swings are higher highs with higher lows on the daily, bias long on pullbacks to structure support.
- When price oscillates between two levels for multiple sessions, switch to range management—short resistance, long support.
- For breakout entries, require a timeframe-close plus one confirming indicator (volume, momentum, or retest).
- Always place stop beyond the invalidation point for your thesis (the swing that, if taken, breaks the structure).
Conclusion
I rely on a clear process to trade trend structure: identify the sequence of swings, confirm with higher timeframe context and volume, choose the appropriate playbook (trend vs range), execute with defined entries and stops, and manage risk accordingly. That step-by-step workflow keeps me disciplined and prevents misapplied strategies.
Step-by-step recap: first, label swing highs and lows on a higher timeframe; second, confirm trend or range with momentum and volume; third, plan entries on pullbacks or retests with stops beyond the invalidating swing; fourth, size positions per risk rules; fifth, monitor order flow and session context to avoid false breakouts.
If you have questions about a specific setup or want me to review a chart, leave a comment and I’ll reply with my assessment and a possible trade plan.