


I started learning to read candlestick charts because raw price numbers and line charts weren’t giving me the context I needed for trades. Over time I learned to treat each candle as a short story of buyer and seller behavior, and that perspective changed how I evaluate trends, entries, and risk.
- Each candlestick shows four data points: open, high, low, and close; the body and wicks tell you momentum and rejection.
- Single-candle shapes (like doji and hammer) suggest indecision or rejection; multi-candle patterns (like engulfing) confirm shifts in control.
- Always read candles in context of trend, support/resistance, and volume—candles don’t act alone.
- Timeframe matters: a bullish candle on a 5‑minute chart means something different than the same shape on the daily chart.
- Use candlesticks with confirmation (volume, trendline break, indicator confluence) to reduce false signals.
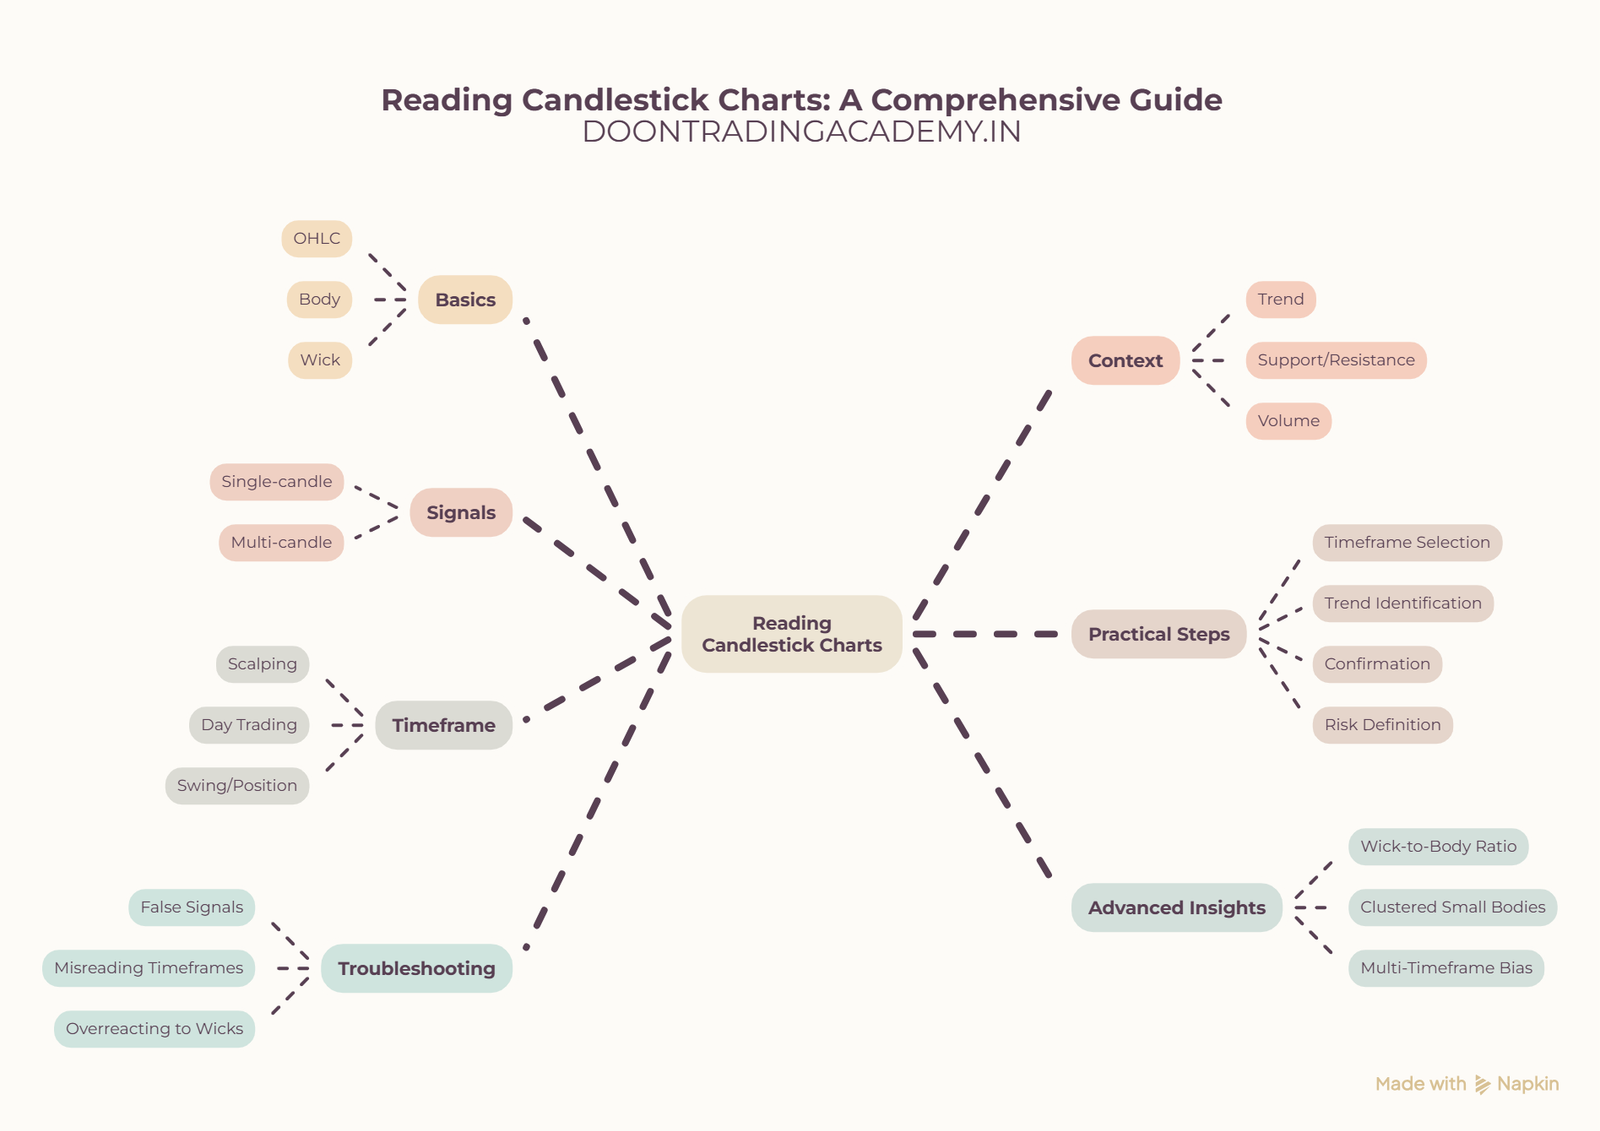
Basics: What a Candlestick Shows
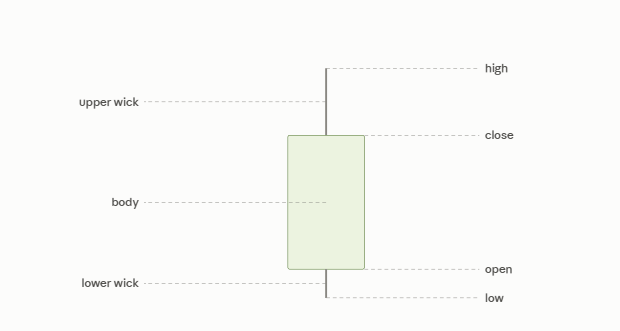
A candlestick compresses four prices into a single readable shape. The top and bottom of the body are the open and close; thin lines above and below are wicks showing the high and low.
Anatomy of a Candle
The body represents net price movement during the period. A long body signals strong conviction; a short body shows indecision.
The upper wick shows how high price went before sellers pushed it down; the lower wick shows how low price fell before buyers pushed it up.
Key terms
- Open, High, Low, Close (OHLC)
- Body (real body)
- Wick / Shadow
- Bullish (close above open) and Bearish (close below open)
Reading Candles in Context
A single candle is a snapshot; context provides the narrative. I always check trend direction, nearby support and resistance, and recent volatility before acting on a candle signal.
Trend and Structure
In an uptrend, bullish candles touching resistance are less reliable. In a downtrend, bullish-looking candles may be temporary pullbacks. Candles that align with the larger trend carry more weight.
Support and Resistance
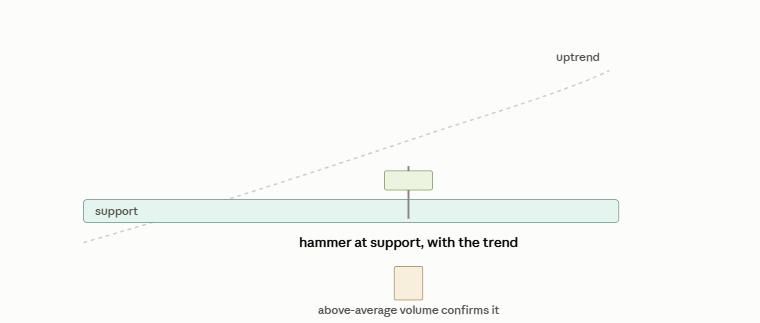
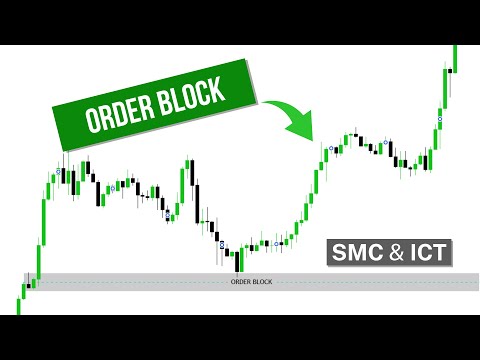
When a strong wick rejects a price level at support or resistance, it signals buyer/seller rejection. I treat long wick rejections at support as potential entries if other signals align.
Volume and Confirmation
Volume is the most common confirmation. A large bullish candle on above-average volume is more convincing than one on low volume. I look for matching volume spikes when I change bias.
Common Candlestick Signals and What They Mean
Memorize a few reliable shapes and patterns, but always require context and confirmation. Below are common single-candle and multi-candle signals I use regularly.
Single-candle patterns
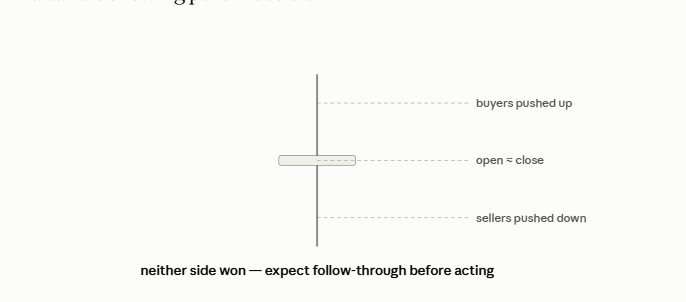
- Doji — open and close nearly equal; signals indecision. I expect follow-up action before trading.
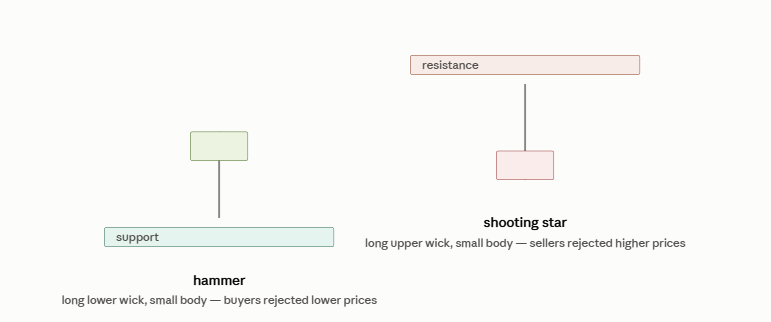
- Hammer / Hanging Man — small body with long lower wick; at support, it suggests rejection of lower prices.
- Shooting Star / Inverted Hammer — small body with long upper wick; often signals rejection at higher prices.
Multi-candle patterns
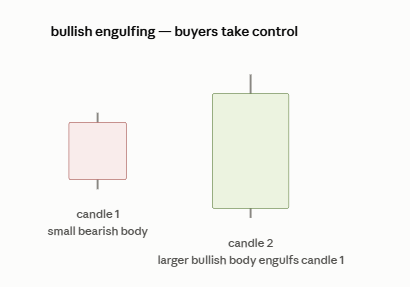
- Engulfing — one candle fully engulfs the prior candle’s body; bullish engulfing at support can mark trend reversal.
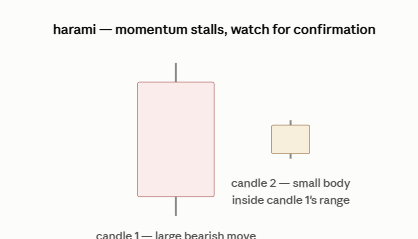
- Harami — a small candle inside prior candle’s body; often a pause or potential reversal sign.
- Three-line strikes, Morning/Evening Star — multi-candle reversal patterns that require confirmation.
Practical Steps to Read and Trade Using Candlesticks
I follow a repeatable process when interpreting candlesticks. It keeps my decisions objective and consistent.
- Pick the timeframe that matches your trading style (scalp, swing, position).
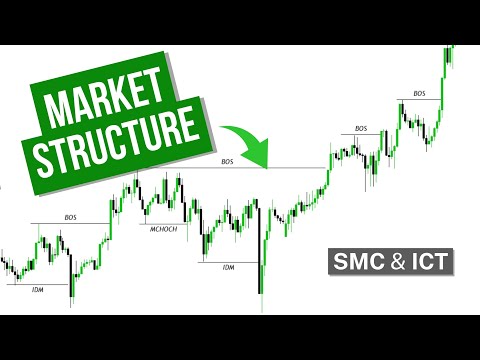
- Identify the prevailing trend and major support/resistance levels.
- Look for candlestick structures at those levels—focus on rejection wicks and engulfing bodies.
- Confirm with volume, a trendline or moving average, and at least one additional indicator if needed.
- Define risk (stop-loss) based on candle structure—use the wick extremes or the recent structure low/high.
Table: Single-candle vs Multi-candle Signals
| Single-candle Signals | Multi-candle Signals |
|---|---|
| Quick snapshot of sentiment (e.g., doji, hammer) | Require sequence and confirmation (e.g., engulfing, morning star) |
| Faster but higher false-signal rate | Slower to form but typically stronger signal |
| Best used with strong support/resistance | Best used to confirm a shift in control between buyers and sellers |
Timeframe and Volatility Considerations
Candles on a one-minute chart are noise; on a daily chart they represent real shifts in market consensus. I always align the candle timeframe with my trade horizon.
Matching timeframe to strategy
- Scalping: 1–5 minute candles (fast signals, high noise).
- Day trading: 5–60 minute candles (balance of signal and noise).
- Swing/Position: 4‑hour to daily candles (stronger structural signals).
An educational YouTube channel that breaks down Smart Money Concepts (SMC) and ICT-based price action using real chart examples — helping traders build genuine conceptual clarity instead of relying on indicators. Powered by Doon Trading Academy. Educational content only, no trading calls or profit guarantees.
Advanced insights: five beyond-common-sense facts
- Wick-to-body ratio is predictive: candles with very long wicks relative to body often precede temporary reversals because they show extreme rejection within the period.
- Clustered small bodies (a “congested” area) before a large directional candle often mark accumulation/distribution and precede strong breakouts when volume spikes.
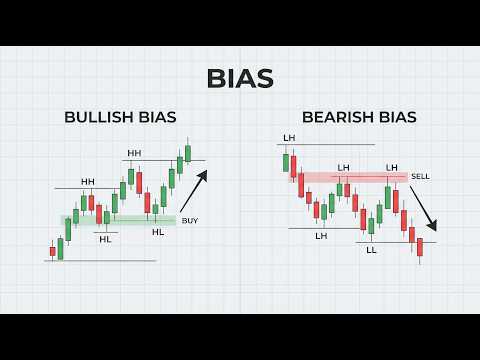
- Directional bias across multiple timeframes matters: a bullish daily engulfing in a downtrend higher timeframe may be a retracement, not a trend change—multi-timeframe alignment increases reliability.
- Candlestick patterns have different reliability depending on market regime; patterns perform worse in low-liquidity conditions and better during trending markets with clear participation.
- Partial candle inspection (only open/close without wicks) misses key rejection signals—platforms that hide wicks can produce misleading signals and increase error rates.
Table: Bullish vs Bearish Candle Comparison
| Bullish Candle | Bearish Candle |
|---|---|
| Close above open; long body suggests buying pressure | Close below open; long body suggests selling pressure |
| Long lower wick at support indicates buyer rejection | Long upper wick at resistance indicates seller rejection |
| Prefer confirmation with rising volume | Prefer confirmation with rising volume |
Using Candlesticks with Indicators and Price Action
Candlesticks are best when combined with other evidence. I often use moving averages for trend, RSI for momentum extremes, and volume to confirm participation.
For structured learning, I link candlestick observations to pattern guides and timeframe rules. For example, see my candlestick patterns guide for pattern examples and our trading timeframes explained page for matching timeframes.
When several signals align (trend, structure, candle pattern, and volume), my conviction increases and I tighten my execution rules.
Troubleshooting: Common Problems and How I Fix Them
I used to chase single candles and get eaten by false breakouts. Here are the problems I encountered and the fixes that worked for me.
Problem: False signals from isolated candles
Fix: I wait for confirmation—either a follow-through candle or a volume spike. That simple habit reduced my losing trades substantially.
Problem: Misreading candles across timeframes
Fix: I always check at least two higher timeframes before taking a trade. If the daily shows a strong trend against my intraday candle signal, I avoid or size down the trade.
Problem: Overreacting to wicks
Fix: I measure wick length relative to recent candle bodies and structure. A long wick at a key level with supporting volume now means action; a lone long wick in the middle of consolidation usually does not.
Users on forums often reflect this learning curve. For example, u/TradeStudent wrote, “I learned the hard way that candlesticks need context—I stopped taking every hammer as a buy sign.” Another common observation is from u/technical_trader: “Candles tell the story—don’t trade a single candle in isolation.”
Further reading and internal resources
To deepen your skill, read a dedicated candlestick patterns guide and the article on trading timeframes explained to match signals to your style.
Conclusion
I learned to read candlestick charts by focusing on the story each candle tells: who tried to push price and who won by the close. That perspective, combined with trend analysis and volume confirmation, turned vague shapes into actionable signals.
Step-by-step recap: identify the timeframe, determine trend and structure, look for meaningful candle shapes at key levels, confirm with volume or higher-timeframe alignment, and define risk using candle extremes. Following these steps keeps my trades structured and repeatable.
If you have questions about a specific candle pattern or want feedback on a chart, leave a comment and I’ll respond with my observations and suggestions.