



I learned early in my trading journey that charts speak a different language than classroom slides. Theory gives you frameworks and labels; real charts force you to interpret price, volume, and order flow in the moment.
In this article I explain why hands-on chart work consistently outperforms classroom theory for building a repeatable trading edge, and I outline practical steps you can use to bridge the gap between what you read and what actually trades well in . markets.
Quick summary
- Practical chart work trains pattern recognition, probabilistic thinking, and market context — things classroom theory often treats as static rules.
- Classroom theory provides concepts; chart work converts those concepts into trader-specific signals through repetition and feedback.
- Backtesting, journaling, and .-demo practice are the core activities that turn chart observations into an edge.
- Volume, order flow, and time-of-day effects are examples of market features that rarely get enough emphasis in theory classes but matter in real trading.
- Follow a structured, repeatable routine: observe, hypothesize, test, refine, and document.
What classroom theory teaches
Classroom material is valuable: it introduces risk management, risk-reward calculations, and common chart patterns. These are the lenses through which many traders first view markets.
However, classrooms often present simplified models — idealized patterns on clean charts — that can leave learners unprepared for the noise, slippage, and ambiguity of . markets.
Where classroom theory falls short
Theory tends to emphasize deterministic rules: “if X then Y.” Real price action is probabilistic; the same setup can fail or succeed depending on context.
Classrooms rarely simulate real-time stresses: execution latency, partial fills, and emotional responses to a losing streak. Those practical constraints alter outcomes materially.
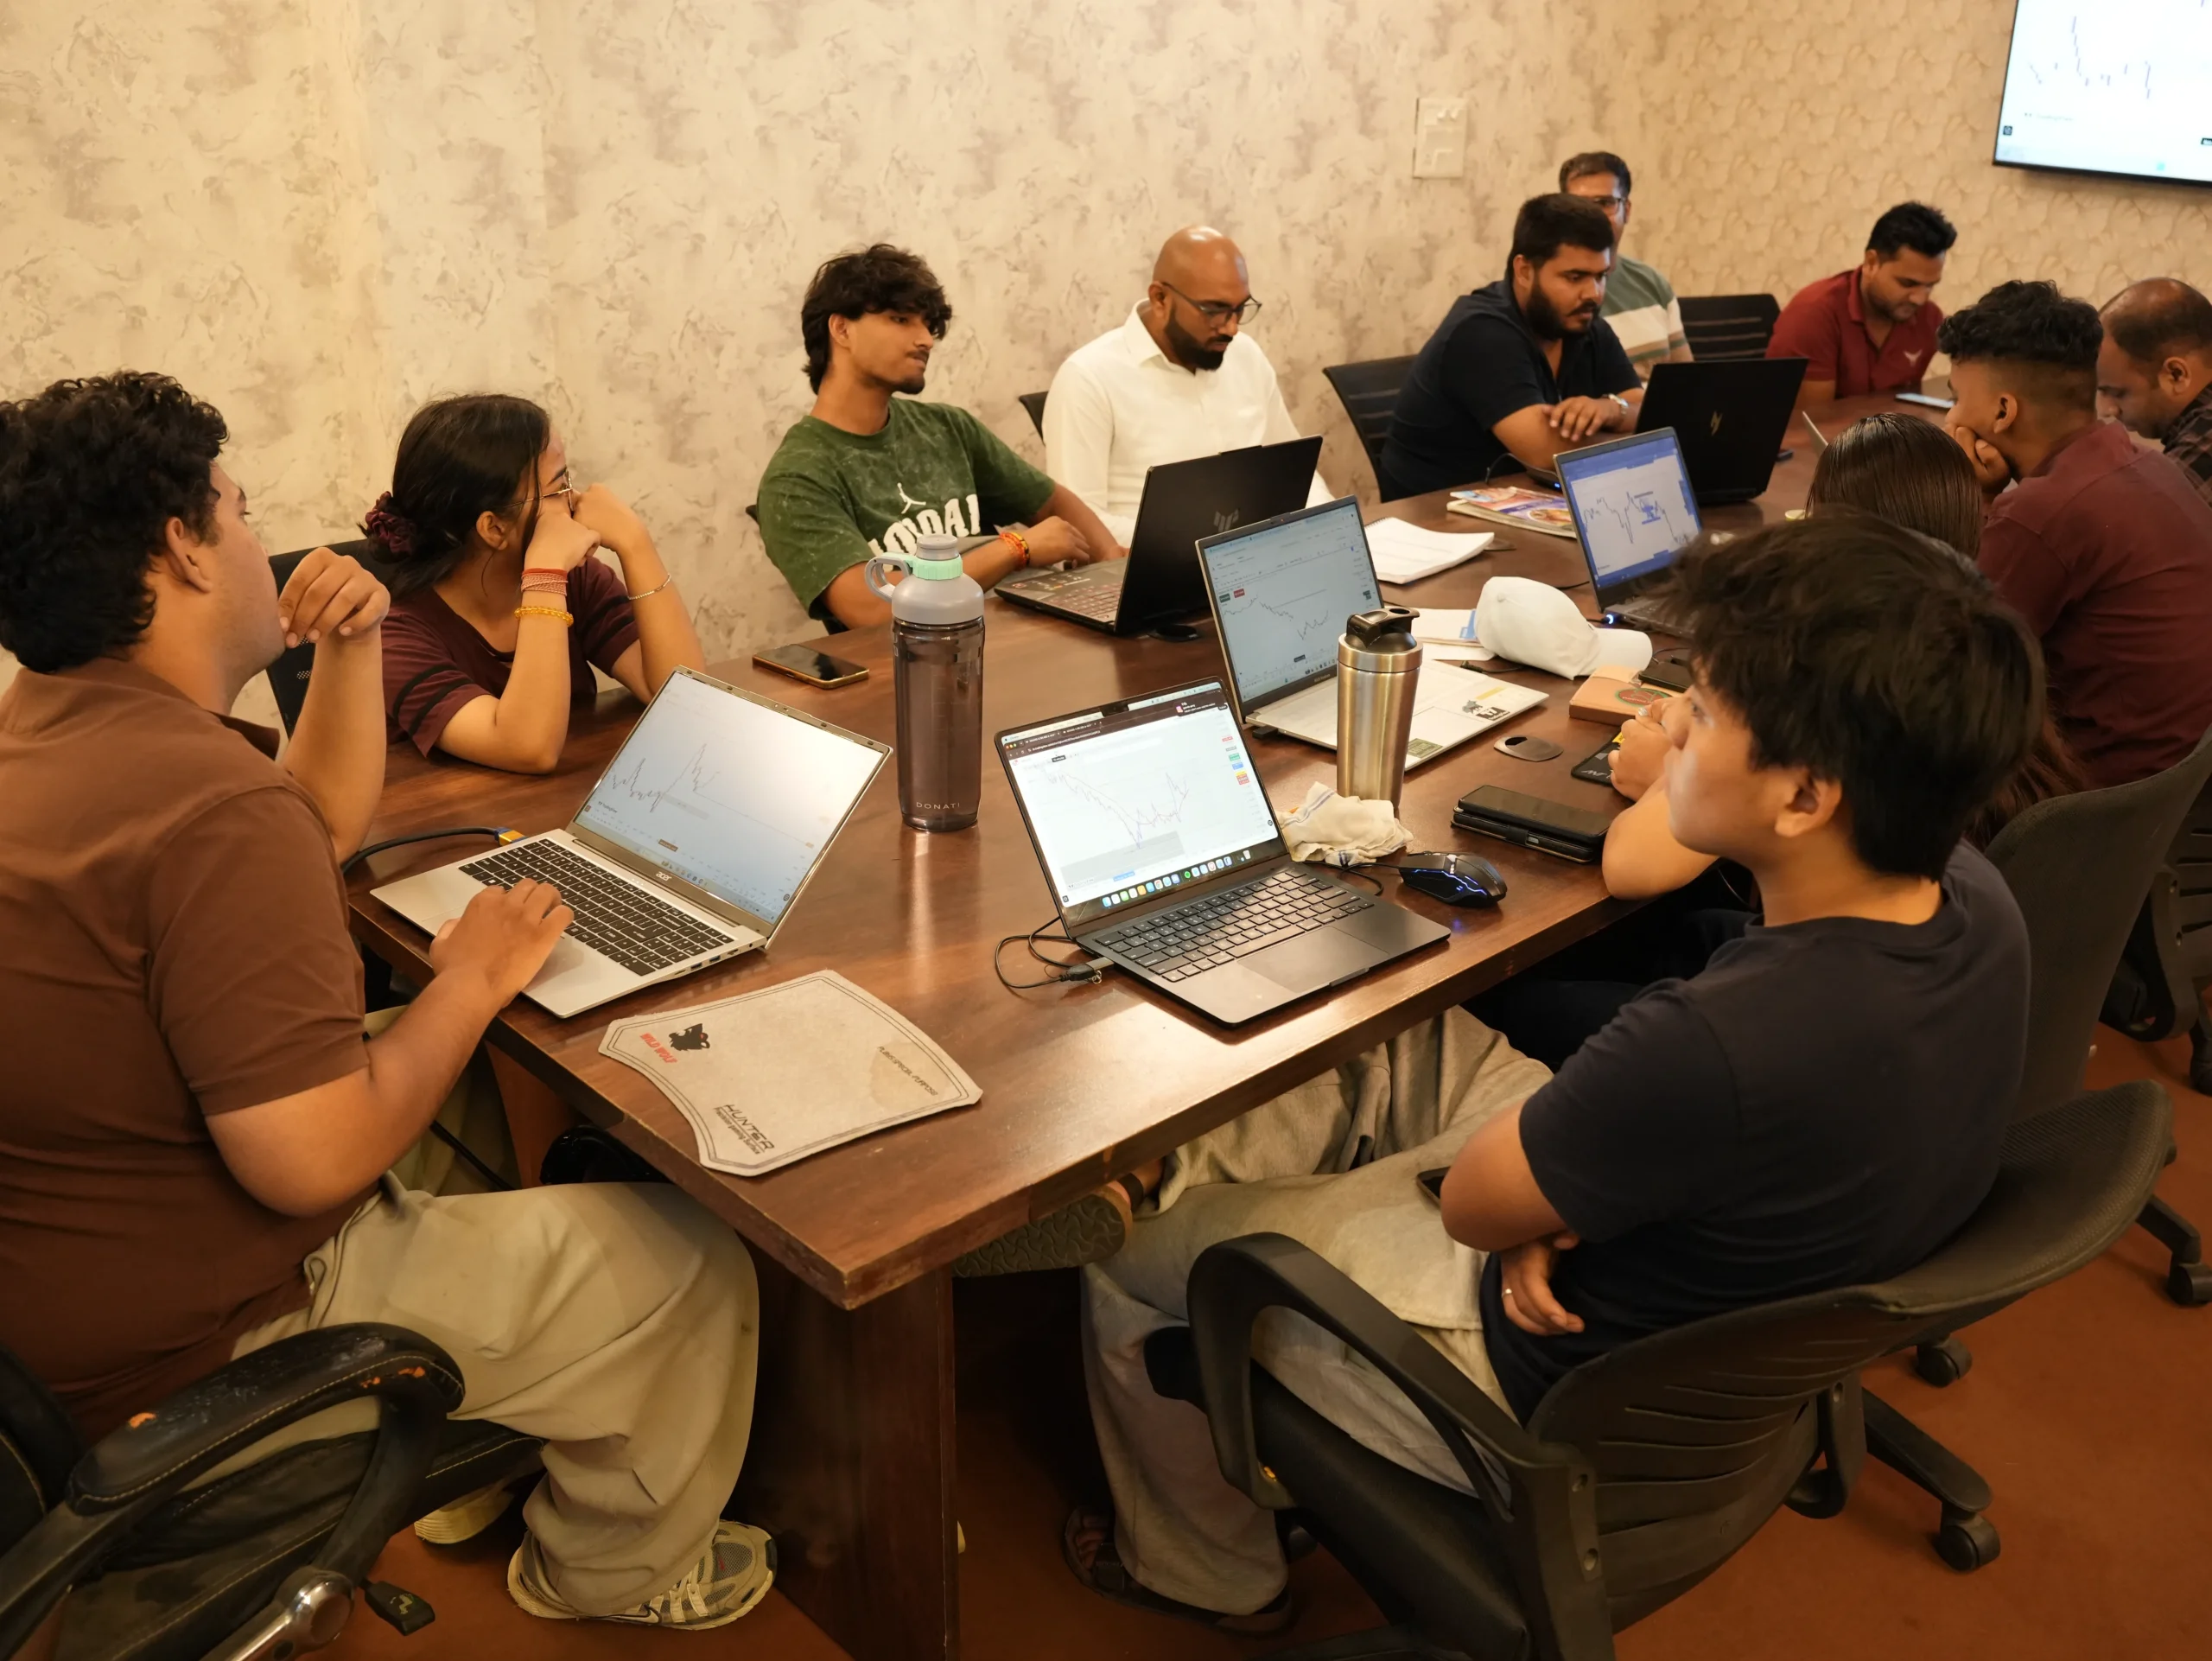
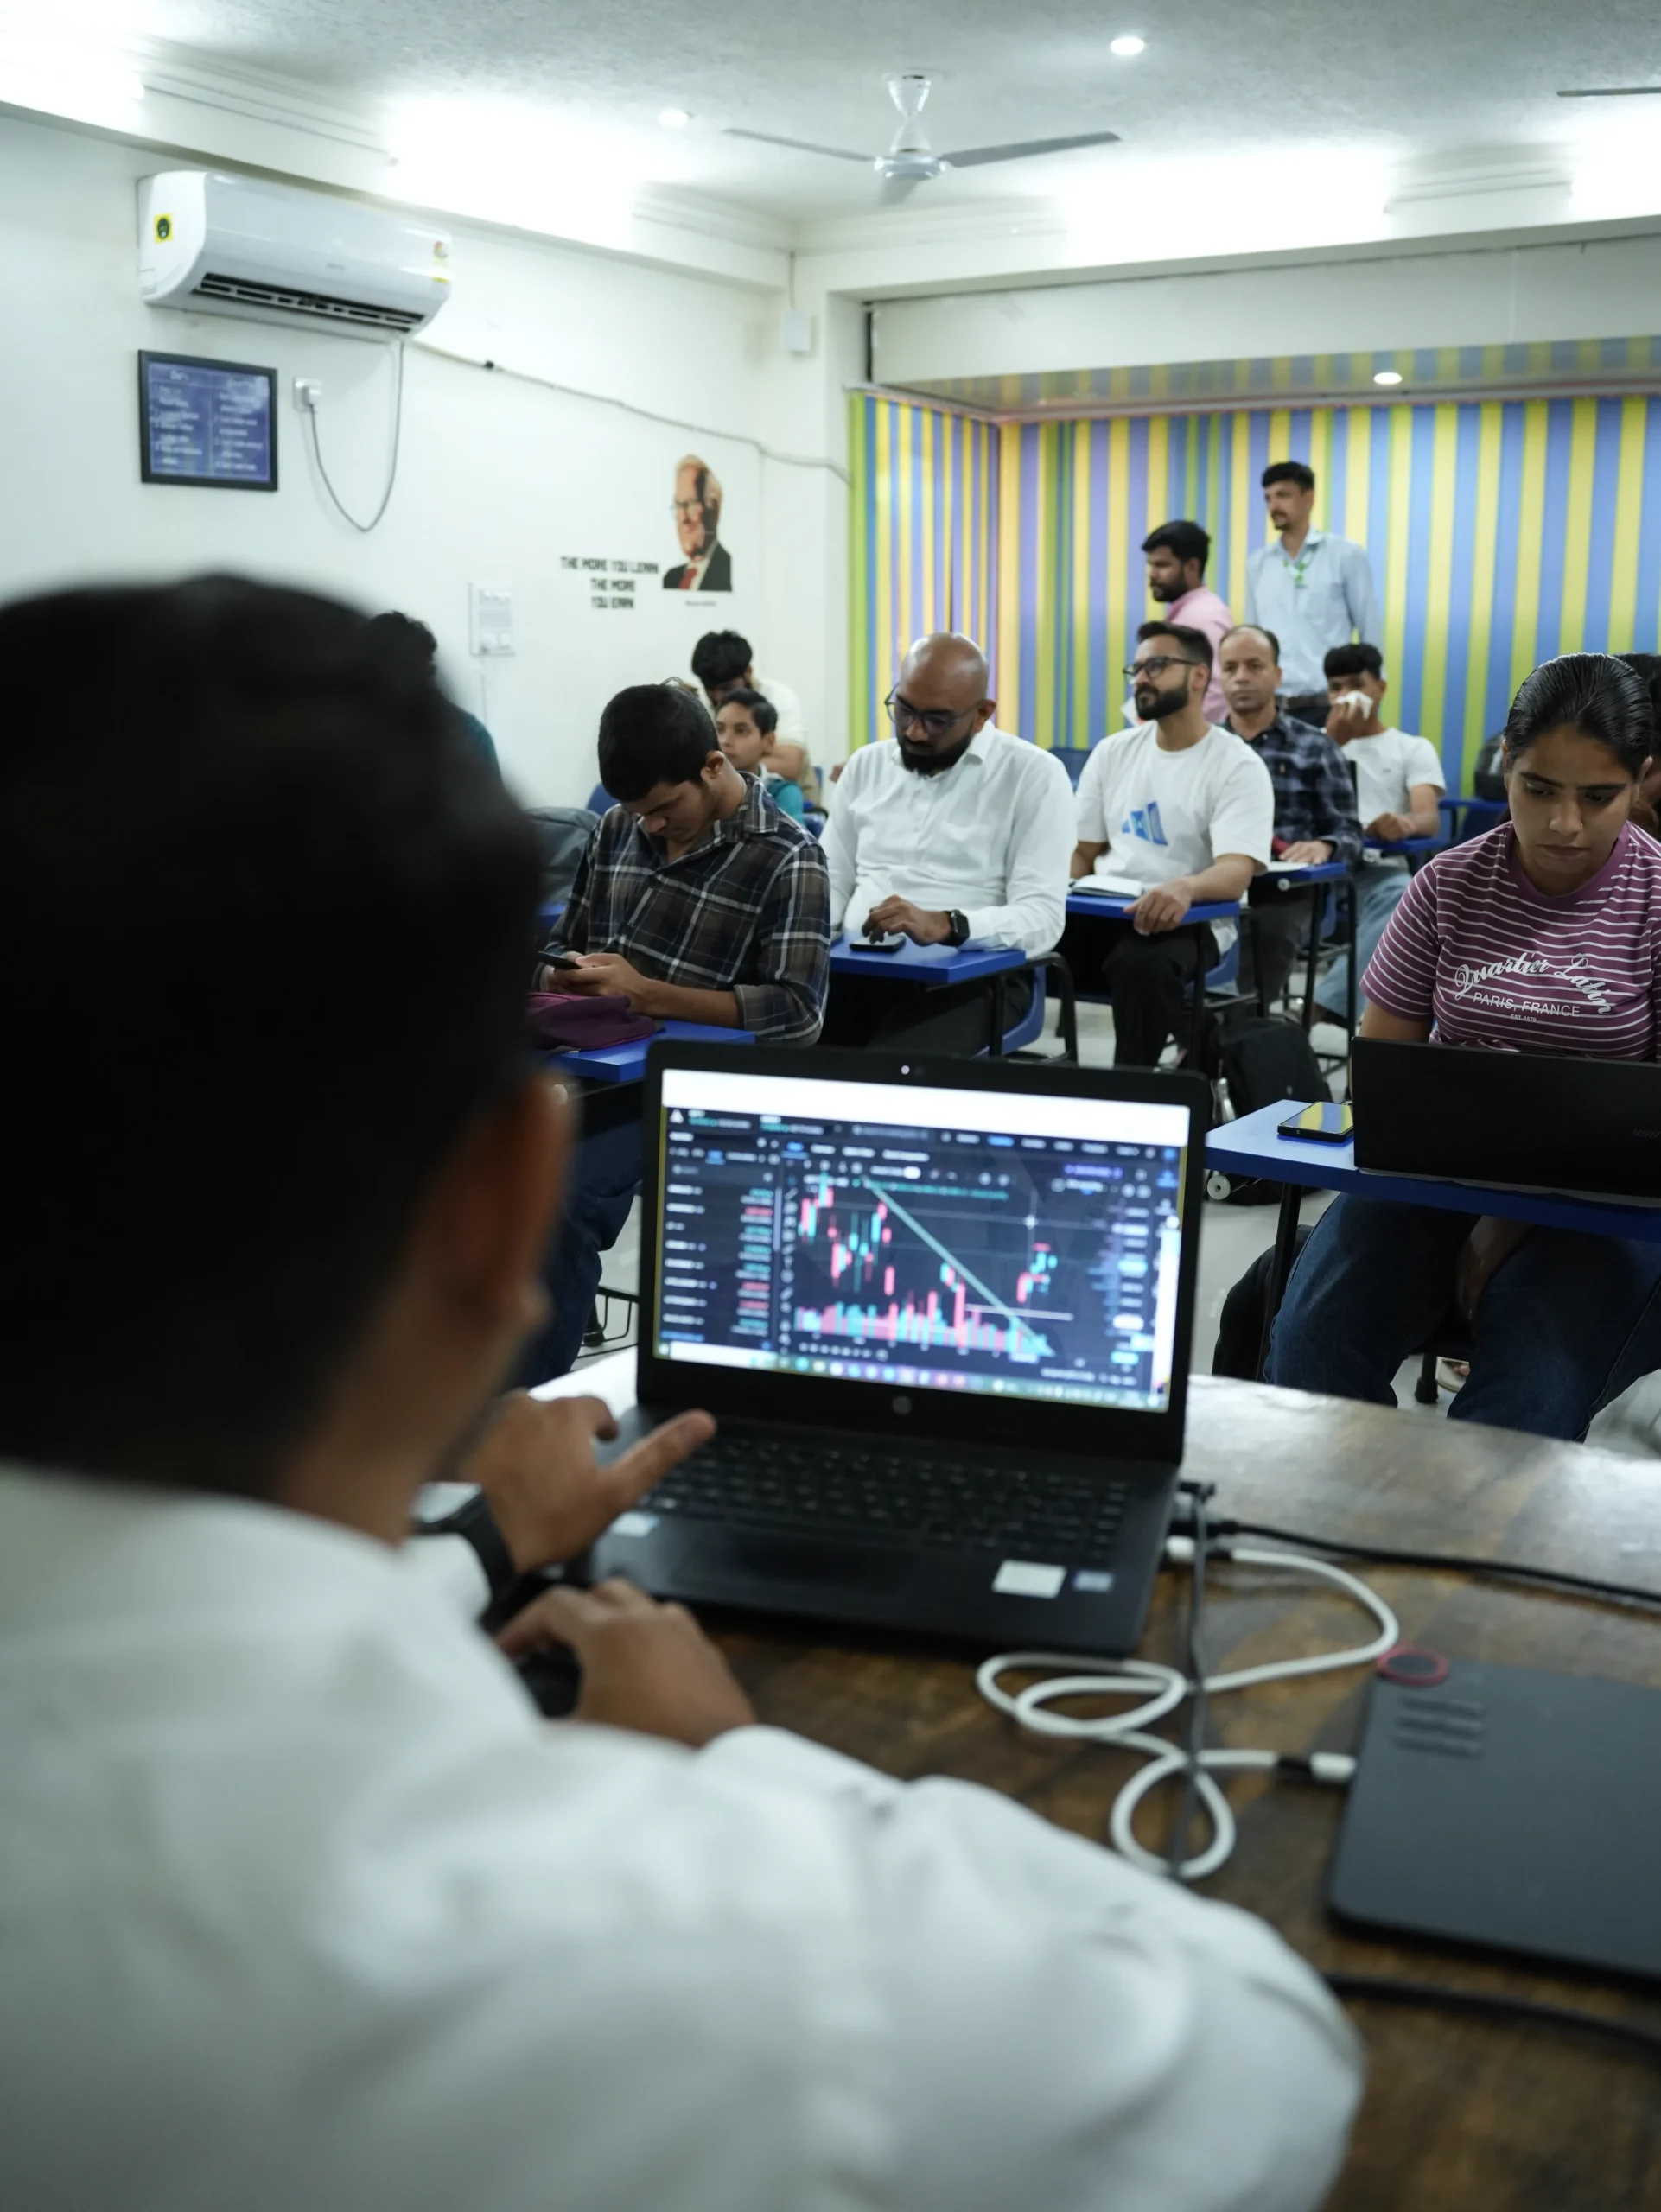
Also, here is all our trading classroom images from all the braches.
Practical chart work: what it actually trains
Chart work trains several merchantable skills you won’t get from slides alone. The primary ones are observation, context assessment, and rapid pattern classification under . conditions.
Repeated manual review of charts develops an internal library of market states and likely next moves. That internal library is what experienced traders rely on when the textbook answer is ambiguous.
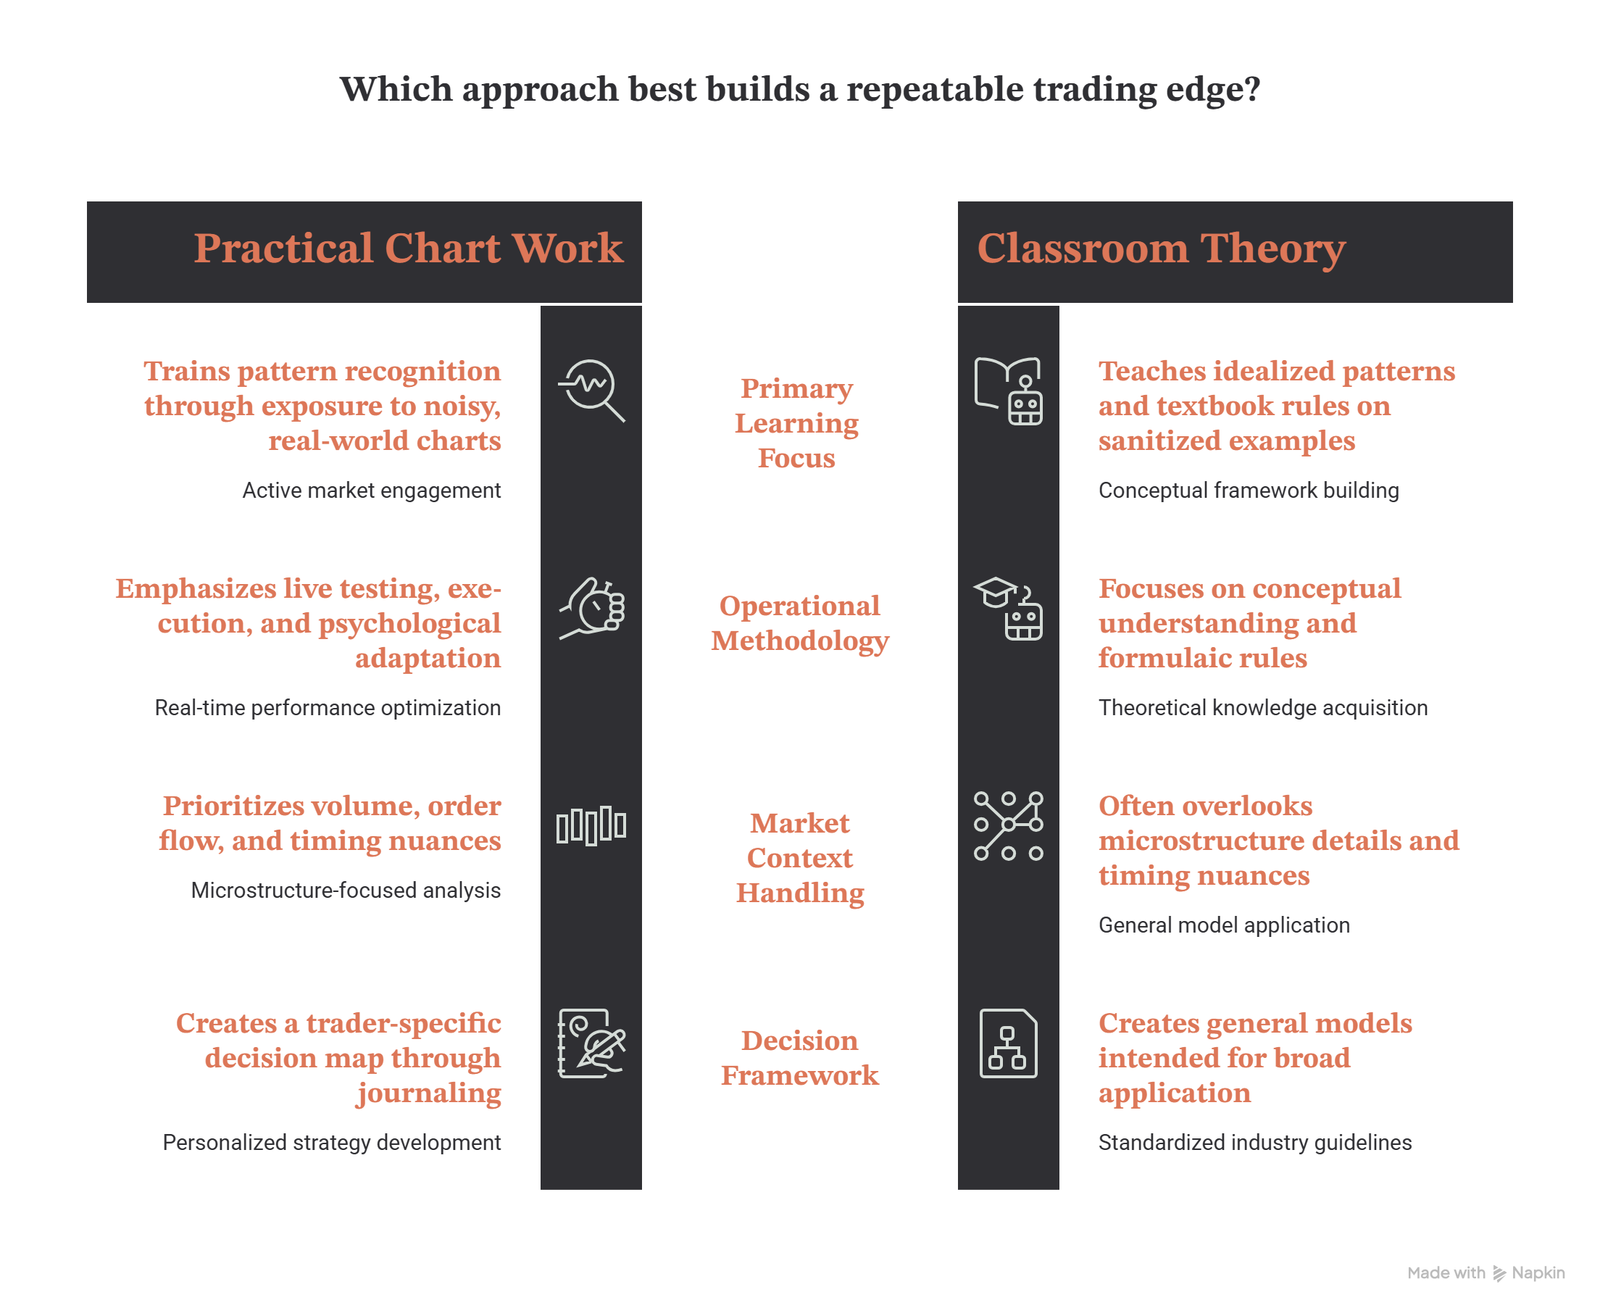
Comparison: Practical chart work vs Classroom theory
| Practical chart work | Classroom theory |
| Develops pattern recognition through repeated exposure to noisy, real charts. | Teaches idealized patterns and textbook rules on sanitized examples. |
| Emphasizes . testing, execution, and psychological adaptation. | Focuses on conceptual understanding and formulaic rules. |
| Prioritizes context: volume, order flow, time-of-day, and correlations. | Often overlooks microstructure details and timing nuances. |
| Creates a trader-specific decision map through journaling and replay. | Creates general models intended for broad application without trader-specific tuning. |
Five advanced insights beyond common sense
- Noise vs signal is timeframe-dependent: a pattern reliable on a 4-hour chart can be worthless on a 1-minute chart because of different participant mixes and execution frictions.
- Volume is a directional filter: identical price patterns with contrasting volume profiles often have opposite outcomes; reading volume helps estimate conviction behind moves.
- Backtest survivorship bias hides real fragility: many textbook setups survive backtests due to selective sample windows; forward-testing on out-of-sample periods reveals true robustness.
- Order-flow mismatches (price moving without matching volume) often precede quick reversals; practical chart work trains you to spot these subtle divergences before they become obvious.
- Humans generalize visually; manual chart review creates tacit knowledge that statistical indicators rarely capture, so blending manual and systematic methods yields better real-world performance.
How to apply practical chart work (step-by-step)
Turn theoretical patterns into usable signals by following a clear, repeatable routine.
- Observe: review replayed sessions and . charts to see how setups resolve in different contexts.
- Hypothesize: write a short rule that defines when you would take a trade and why.
- Test: backtest the rule on historical data, then forward-test in a simulator or small real size.
- Record: keep a concise trading journal with screenshots, rationale, outcome, and execution notes.
- Refine: iterate your rule based on statistical outcomes and your comfort with drawdowns.
- Scale: increase size only after consistent, documented edge over an extended period.
Common mistakes traders make when switching from theory to practice
- Overfitting rules to a few clean examples instead of testing across varied market regimes.
- Ignoring execution costs and slippage when translating backtested results into . sizing.
- Failing to document edge decay: markets adapt, and setups that worked last year may need revalidation.
- Relying solely on indicators without context — indicators lag and can confirm moves only after they are underway.
- Neglecting psychology: fear and impatience change how rules are executed in . conditions.
Troubleshooting
I use troubleshooting as a regular part of my practice. When a setup stops working, my first step is not to discard it, but to diagnose why it failed in the current context.
Common diagnosis steps I follow include replaying the trade to check execution, comparing the session’s volume profile to typical conditions, and testing the rule on adjacent instruments to see if the effect is instrument-specific.
If I find the failure is due to slippage or spread expansion, I adjust size or timeframes. If the failure is due to changing market structure (for example, a new liquidity provider or a news regime), I either tighten my entry filters or pause the setup until it requalifies by my metrics.
When I document troubleshooting outcomes, I add a short “fix” line in my journal so I can track whether changes restored performance. Iteration is the core of moving from classroom knowledge to a durable trading edge.
Further reading and tools
To support practical chart work, I recommend combining manual analysis with disciplined backtesting. Explore resources on backtesting methods and invest in reliable charting tools that provide high-resolution data and replay capability.
For focused learning, spend time on replay sessions and keep your journal concise — the goal is repeated exposure and swift feedback, not verbose notes that are never reviewed.
Conclusion
I prefer practical chart work because it taught me how to translate classroom concepts into trades I can execute under real conditions. Theory gave me language; charts gave me judgment.
Step-by-step recap: I observe charts, form a hypothesis, backtest the hypothesis, forward-test in small size, document the results, troubleshoot failures, and iterate until the setup is robust. This loop — observe, test, record, refine — is the process that turned classroom ideas into a repeatable edge for me.
If you have experiences or questions about bringing theory into practice, leave a comment — I read and respond to thoughtful examples from readers.