



I often start my analysis by asking a simple question: where will price likely pause or reverse? Over the years I’ve relied on a combination of price action, technical indicators, and market context to identify support and resistance levels that matter. In this article I explain the practical methods I use, common pitfalls I’ve seen, and a repeatable step-by-step process you can follow.
- Support and resistance are zones where supply and demand imbalance causes price to pause, reverse, or accelerate.
- Use multiple methods—price structure, volume, moving averages, and round numbers—to find higher-probability levels.
- Confluence (agreement between methods) beats a single signal every time.
- Always confirm breakouts with retests, volume, or order-flow context to avoid false breakouts.
- Price reacts to levels differently across timeframes; align timeframe context with your trading horizon.
What are support and resistance?
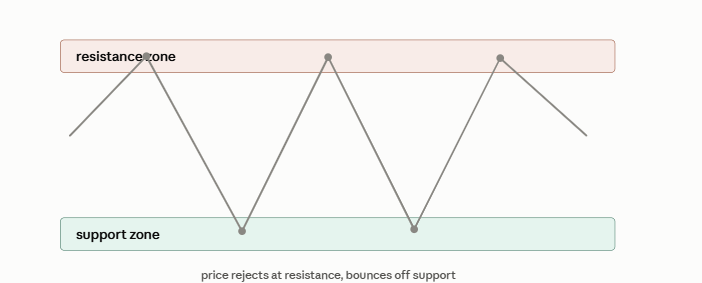
Support is a price area where buying interest tends to exceed selling, causing a pause or bounce. Resistance is where selling interest tends to exceed buying, causing a pause or pullback. Think of them as demand and supply zones rather than single lines.
These levels form from visible market behavior: repeated bounces, rejections, consolidation ranges, or strong reactions to volume. The more times price has reacted at a zone, and the more market participants are aware of it, the stronger it becomes.
How levels are identified
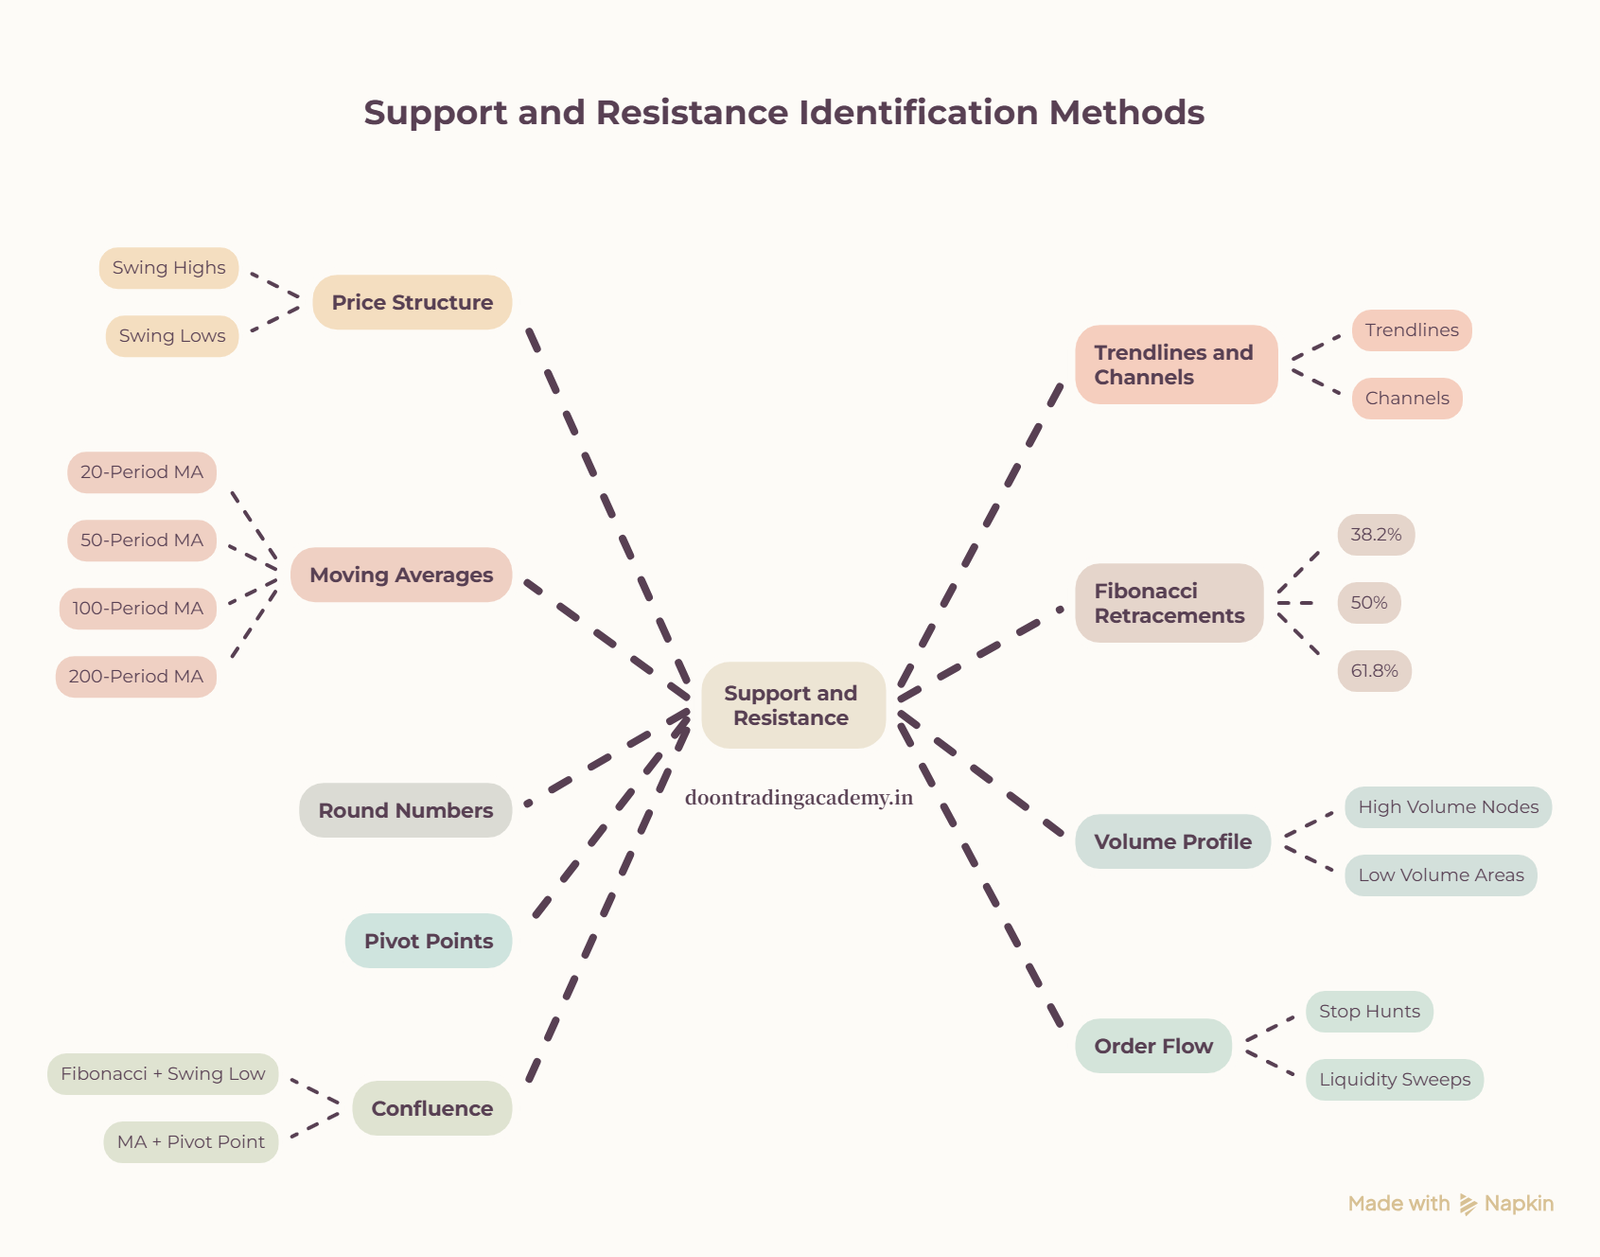
1) Price structure: swing highs and swing lows
Mark recent swing highs and swing lows on the timeframe you trade. These are natural starting points because they represent places where buyers or sellers previously changed control. I treat those levels as potential support or resistance zones rather than exact lines.
2) Trendlines and channels
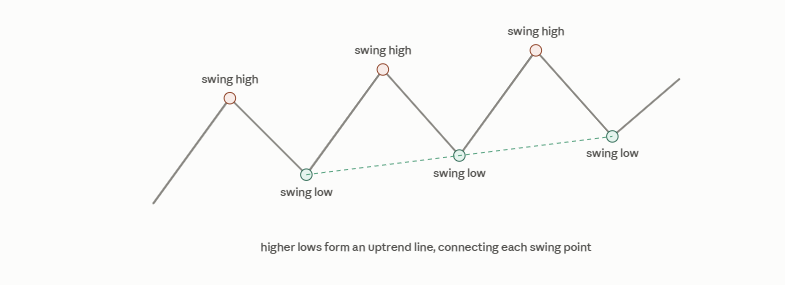
Draw trendlines by connecting at least two significant swing points; three points give validation. Channels offer parallel support and resistance. I prefer lines drawn from structural highs/lows over connecting every minor pivot.
3) Moving averages as dynamic levels
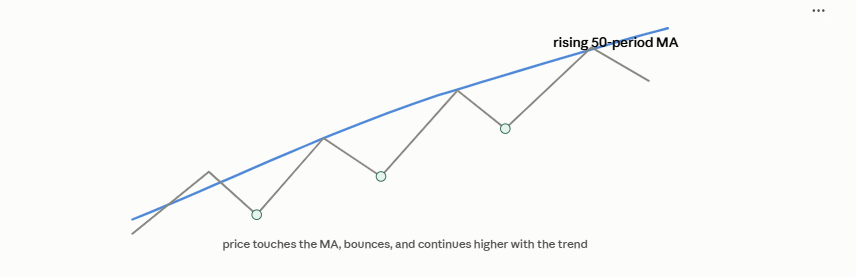
Common moving averages—20, 50, 100, 200—act as dynamic support or resistance. Shorter MAs are useful for intraday and swing entries; longer MAs are more relevant for trend bias and institutional interest. Watch how price interacts with an MA: smooth bounces indicate support; weak or noisy interactions indicate a low-probability zone.
4) Fibonacci retracement and extensions
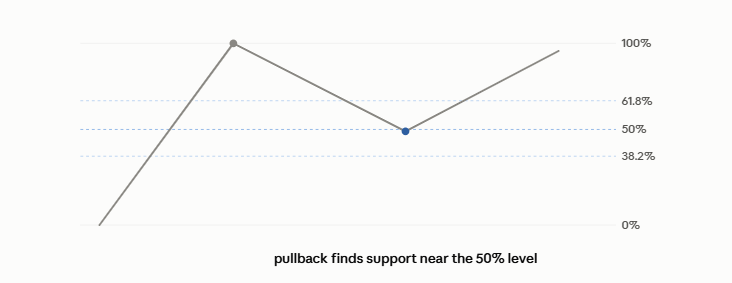
Use Fibonacci retracements to highlight likely pullback zones inside a trend (38.2%, 50%, 61.8%). I combine Fibonacci with structural swing points to avoid blind reliance on mathematical levels alone.
5) Round numbers and psychological levels
Whole numbers (e.g., 1.3000, 1500) tend to collect orders and attention. These psychological levels are not strong technical reasons by themselves but gain power through trader behavior and stop clustering.
6) Volume profile and market profile
High volume nodes often align with support or resistance because they show areas of price acceptance. Low volume areas can act as magnet zones for fast moves. I use volume profile to add context where traditional horizontal levels are ambiguous.
7) Pivot points and session levels
Daily and weekly pivot points, as well as open/high/low of sessions, are widely used by traders. They perform best when combined with structural levels and volume evidence.
8) Order flow and liquidity sweeps
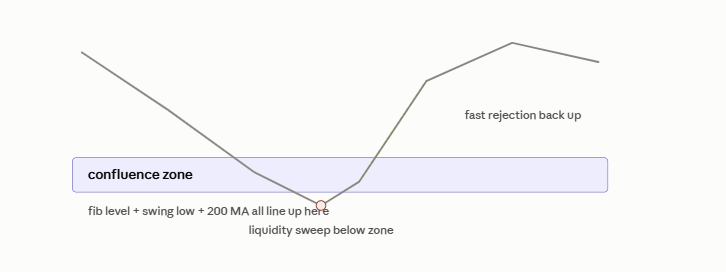
Where available, order-flow tools reveal stop hunts and liquidity sweeps—events where price briefly probes beyond visible support/resistance to trigger orders. I treat those probes as information: a sweep followed by a quick rejection often signals a strong underlying level.
9) Confluence: combining methods for higher probability
Confluence is when two or more methods align at the same zone—e.g., a 61.8% Fibonacci retracement coinciding with a previous swing low and a 200-moving average. I prioritize such zones for entries and larger position sizing.
Step-by-step identification process
Follow this repeatable workflow I use for every setup:
- Choose the timeframe that matches your trade horizon (daily for swing, 5–60 min for intraday).
- Mark major swing highs and lows to outline market structure.
- Add trendlines or channels to define directional bias.
- Plot moving averages and key Fibonacci retracements from the latest impulse move.
- Overlay volume profile or review session volume to find high-volume nodes.
- Highlight round numbers and standard pivot levels near structural zones.
- Look for confluence—prioritize zones where multiple methods overlap.
- Wait for confirmation: retest, price rejection candle, increased volume, or order-flow signal.
- Manage risk: place stop-loss beyond the level’s invalidation point and size position accordingly.
| Method | Why it helps |
| Swing highs/lows | Shows historical points of control where supply/demand flipped |
| Trendlines | Provides directional bias and dynamic areas of interest |
| Moving averages | Act as dynamic support/resistance and attract institutional orders |
| Fibonacci | Highlights mathematically common retracement zones used by traders |
| Volume profile | Identifies where market participants agree on price (high volume nodes) |
Common signals for confirmed levels
Confirmation reduces false signals. I look for a combination of the following before treating a zone as valid:
- Price retest and clear rejection (e.g., pin bar, engulfing candle).
- Increased volume on the reaction compared to the prior move.
- Order-flow signs such as fast rejection after a liquidity sweep.
- Multiple timeframes agreeing on the zone—higher timeframe support/resistance above intraday ones.
Advanced insights (beyond common sense)
- Not all reactions are equal: a bounce on low volume often signals weak support, while a bounce on high volume indicates structural absorption of supply.
- Historic highs/lows lose relevance as the market evolves; the most actionable levels are typically those formed during the current market regime or within the last significant trend.
- Moving averages can flip roles depending on slope and spacing: a flat 200-period MA is less reliable than a rising one, even if price touches it the same way.
- Price often “tests” a level multiple times and weakens with each successful test; the third or fourth test commonly precedes a strong break unless fresh liquidity arrives.
- False breakouts are frequently followed by powerful moves in the opposite direction because trapped traders create fuel for the return move—watch for snapbacks after sweeping lows/highs.
Troubleshooting support and resistance in real time
When I see a level fail or a setup behave oddly, I follow a short checklist to diagnose the issue and adapt.
Checklist I use
- Reassess timeframe alignment: did I trade a level that only appeared on a lower timeframe?
- Check volume: did the breakout or retest happen on unusually low volume?
- Scan for nearby overlapping event risk—news, economic data, or liquidity windows can override technical levels.
- Look for order-flow anomalies: was there a liquidity sweep that invalidated the apparent level?
Example problem and fix
Sometimes price breaks a support level and then immediately returns above it. I used to treat that as a failed trade, but now I watch for whether the break was a liquidity sweep. If the break was fast and followed by aggressive buying, I consider re-entering on the retest with tighter risk, because trapped sellers often fuel the return move.
On a forum I follow, u/Tradermike wrote: “A clean sweep and quick rejection has saved my scalp trades more than once.” That mirrors my experience—these sweeps often reveal where stop clusters are and who’s actually in control.
Conclusion
I rely on a structured process to identify support and resistance: define the timeframe, map price structure, layer trendlines and indicators, look for volume and confluence, and wait for confirmation before committing capital. In my experience this disciplined approach reduces false signals and improves trade selection.
To recap the step-by-step actionable process: choose the correct timeframe, mark swing highs/lows, draw trendlines and channels, plot moving averages and Fibonacci levels, check volume profile and pivot points, identify zones of confluence, wait for retest/confirmation, then enter with defined risk and a clear invalidation point.
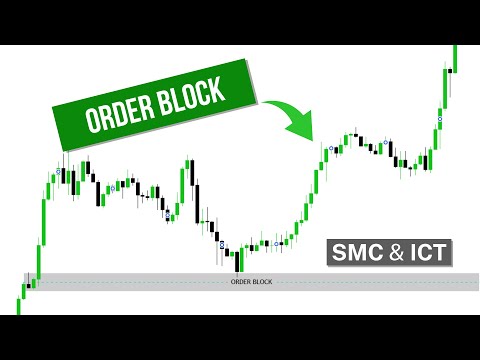
An educational YouTube channel that breaks down Smart Money Concepts (SMC) and ICT-based price action using real chart examples — helping traders build genuine conceptual clarity instead of relying on indicators. Powered by Doon Trading Academy. Educational content only, no trading calls or profit guarantees.
If you found these methods useful, I invite you to try them on a demo account and share your observations. Leave a comment with your favorite way to confirm a level or a trade example you learned from—I read every reply and often respond with suggestions based on my experience.