



I started studying technical analysis because I wanted a repeatable way to read price action and make decisions without relying solely on news. Over time I developed a compact framework that emphasizes observable patterns, probability, and strict risk management. In this article I’ll explain the basics, walk through the step-by-step framework I use, go deeper into the institutional-flavoured concepts that have reshaped how retail traders read charts — Smart Money Concepts (SMC) and ICT (Inner Circle Trader) methodology — answer some common questions people ask me (including whether “chart analysis” and “technical analysis” are the same thing), and share troubleshooting tips from my own experience. I’ll also share a comparison that has genuinely shaped how I think about balance in a trading system: making a proper cup of chai. It sounds odd, but stay with me — it earns its place.
Key takeaways before we start:
- Technical analysis (TA) uses historical price and volume to forecast probable future price behavior.
- TA rests on three core ideas: price discounts everything, price moves in trends, and history often repeats through patterns.
- Start with price action, trend identification, support/resistance, and one or two complementary indicators (e.g., moving averages, RSI).
- Newer frameworks like ICT and SMC add an institutional lens — order blocks, fair value gaps, liquidity, and session timing — on top of the classical foundation.
- Backtest simple rules, size positions with clear risk limits, and always use stop-losses — TA is probabilistic, not certain.
- Five advanced insights: market psychology makes TA partially self-fulfilling; volume context is essential; multi-timeframe confirmation reduces noise; indicators are signals, not decisions; derivatives and liquidity shape price more than retail noise.
What Is Technical Analysis? Core Principles
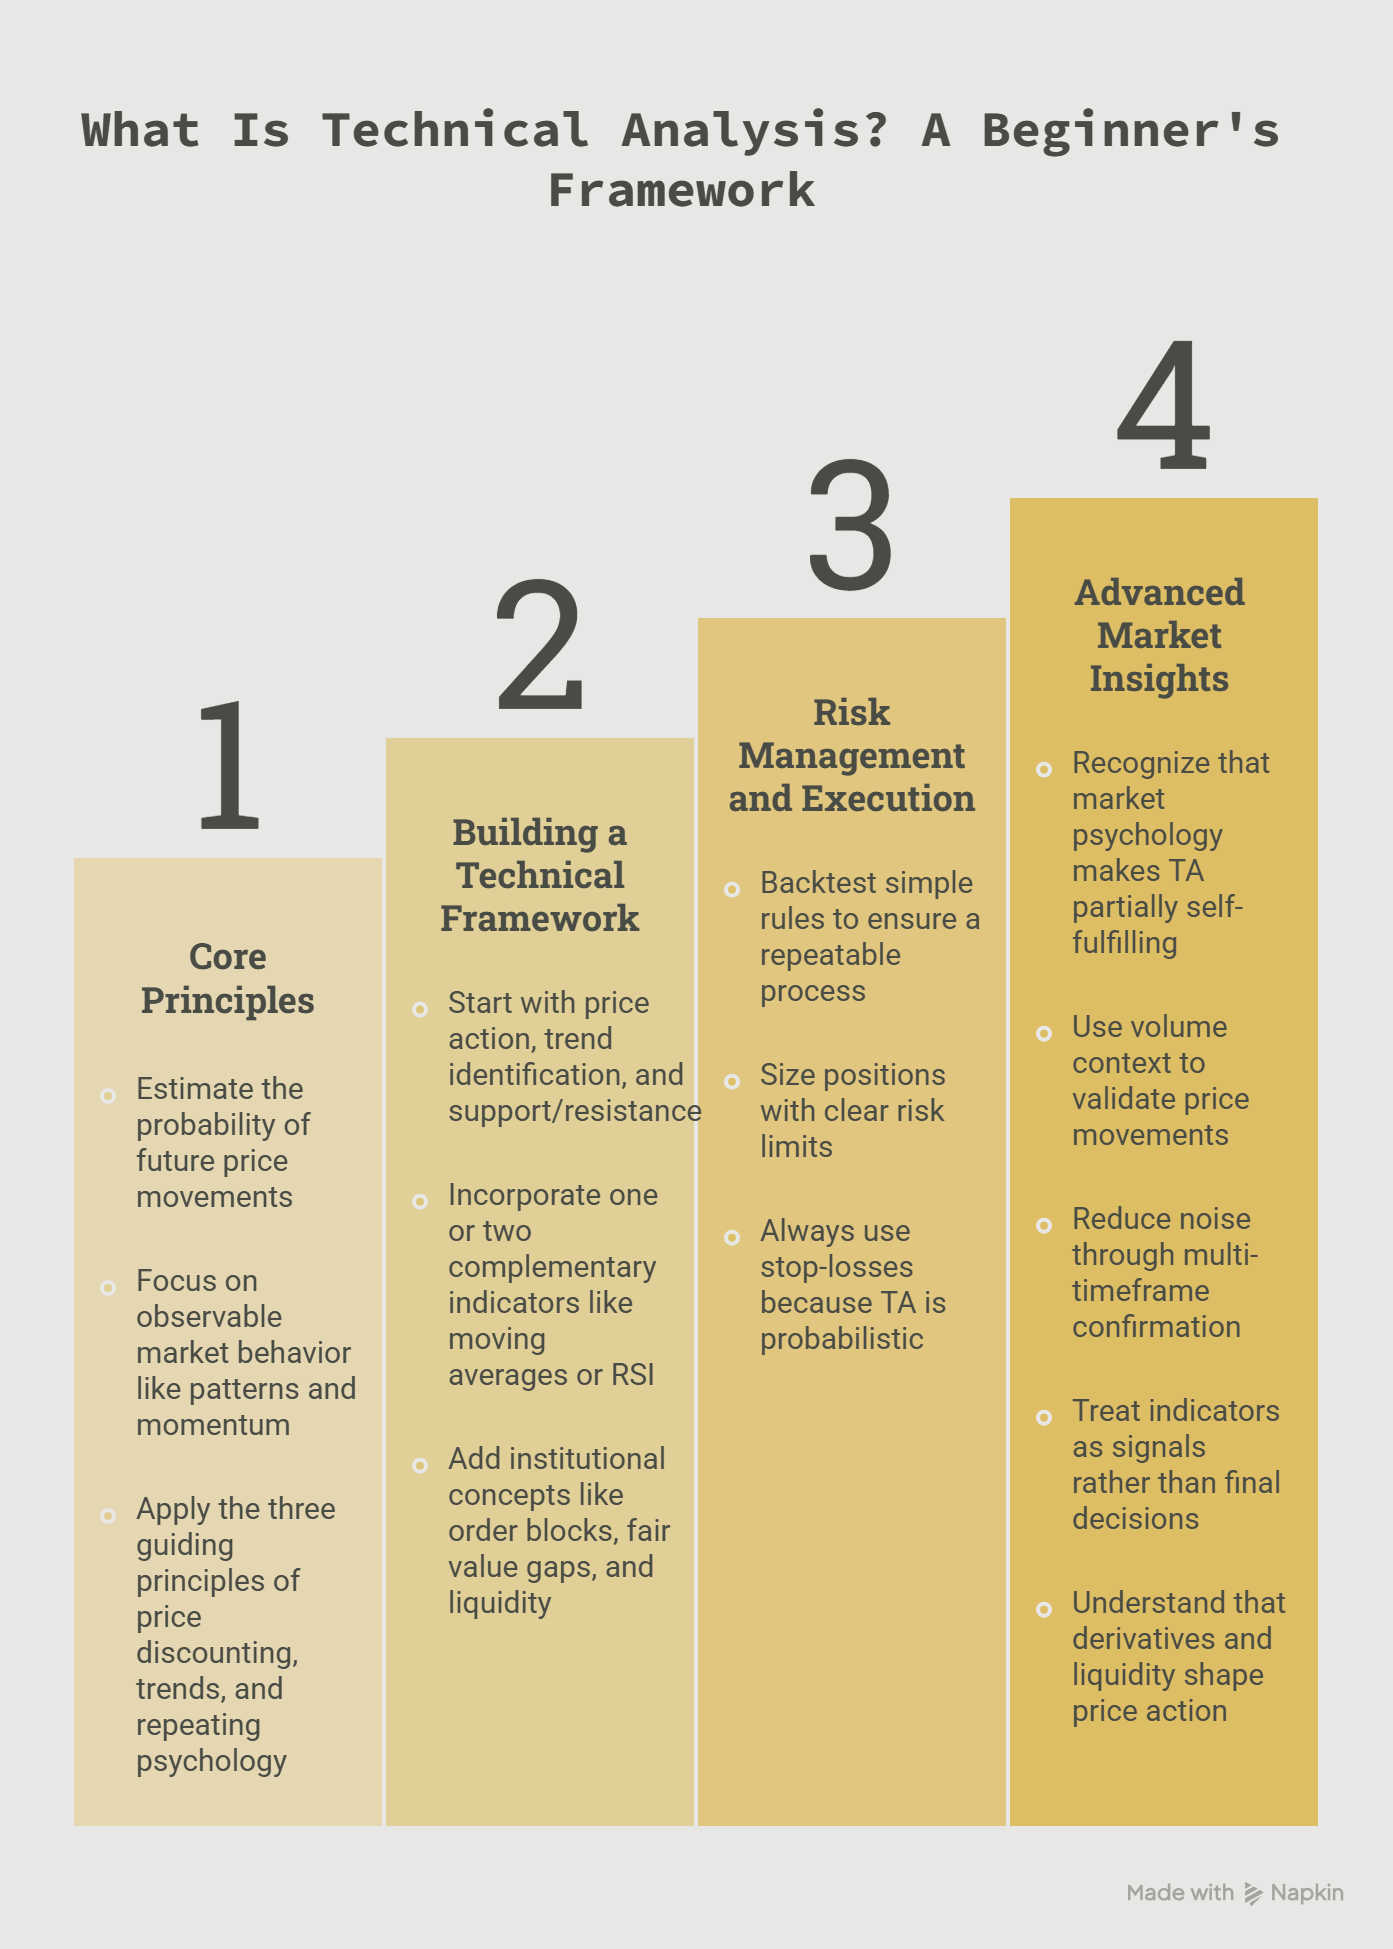
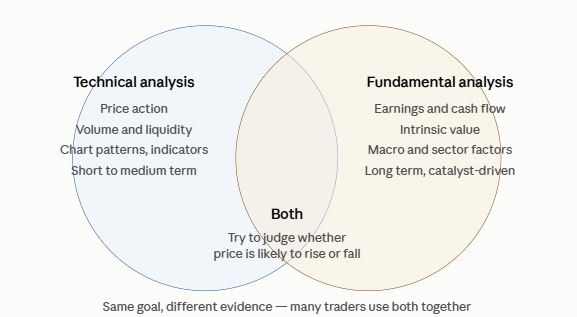
Technical analysis is the study of historical price and volume to estimate the probability of future price movements. Instead of focusing on intrinsic value or company fundamentals, TA focuses on observable market behavior: patterns, momentum, and the balance of supply and demand.
Three guiding principles underlie most TA systems: price discounts everything; price moves in trends; patterns and psychology repeat. These ideas provide the logic behind tools like support and resistance, trendlines, moving averages, and oscillators such as RSI or MACD.
Why This Works (Probabilistically)

Markets are driven by human decisions — emotion, risk tolerance, and crowd behavior. Because many participants use similar tools, common levels and indicators can become self-reinforcing. That makes technical signals useful as probabilistic edges rather than guarantees. This point matters enough that I’ll return to it several times in this article: nothing in TA is a certainty, and any framework that promises certainty should make you suspicious immediately.
Key Tools and Indicators
Start with price charts and volume. From there, add a small toolbox of indicators that answer specific questions: “Is there momentum?”, “Is the trend intact?”, “Where are logical places to place stops?” Keep the toolset minimal to avoid conflicting signals.
Price Action and Charts
Candlestick patterns, trendlines, and bar patterns show direct evidence of buyers and sellers. Reading pure price action helps filter out indicator lag and reveals where breaks and reversals actually occur. This is also the foundation that ICT and SMC build on — those frameworks are, at their core, price-action systems with an institutional interpretation layered on top.
Trend Indicators
Moving averages (simple, exponential) and ADX help identify trend direction and strength. Use moving averages across multiple timeframes for alignment: short-term, intermediate, and long-term.
Momentum Indicators
RSI, stochastic, and MACD measure velocity and potential exhaustion. Momentum divergences — price making new highs while RSI fails to confirm — are useful early warning signs.
Volume and Order Flow
Volume confirms moves. Breakouts with weak volume are more likely to fail. When available, order flow and footprint data give a deeper view of who is executing trades and at what price levels.
Support, Resistance, and Patterns
Horizontal levels (previous highs/lows), trendline support, and chart patterns (head and shoulders, triangles) provide logical entries and exits. Remember: levels become more meaningful the more times they are tested.
Here is more to read about Choosing a perfect course for your trading journey: https://doontradingacademy.in/info/complete-guide-choosing-stock-market-institute-india/
Technical Analysis vs. Fundamental Analysis
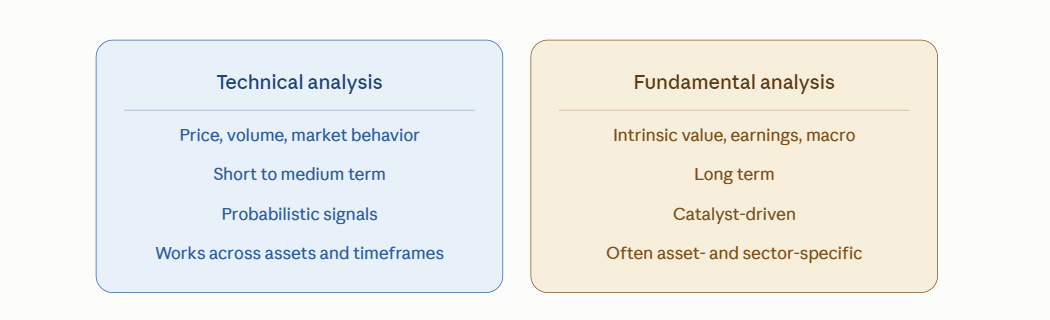
| Technical Analysis (TA) | Fundamental Analysis (FA) |
| Focuses on price, volume, and market behavior | Focuses on intrinsic value, earnings, and macro factors |
| Short- to medium-term edge; probabilistic signals | Long-term valuation; catalyst-driven |
| Works across assets and timeframes | Often asset- and sector-specific |
A Beginner’s Framework: Step-by-Step Process
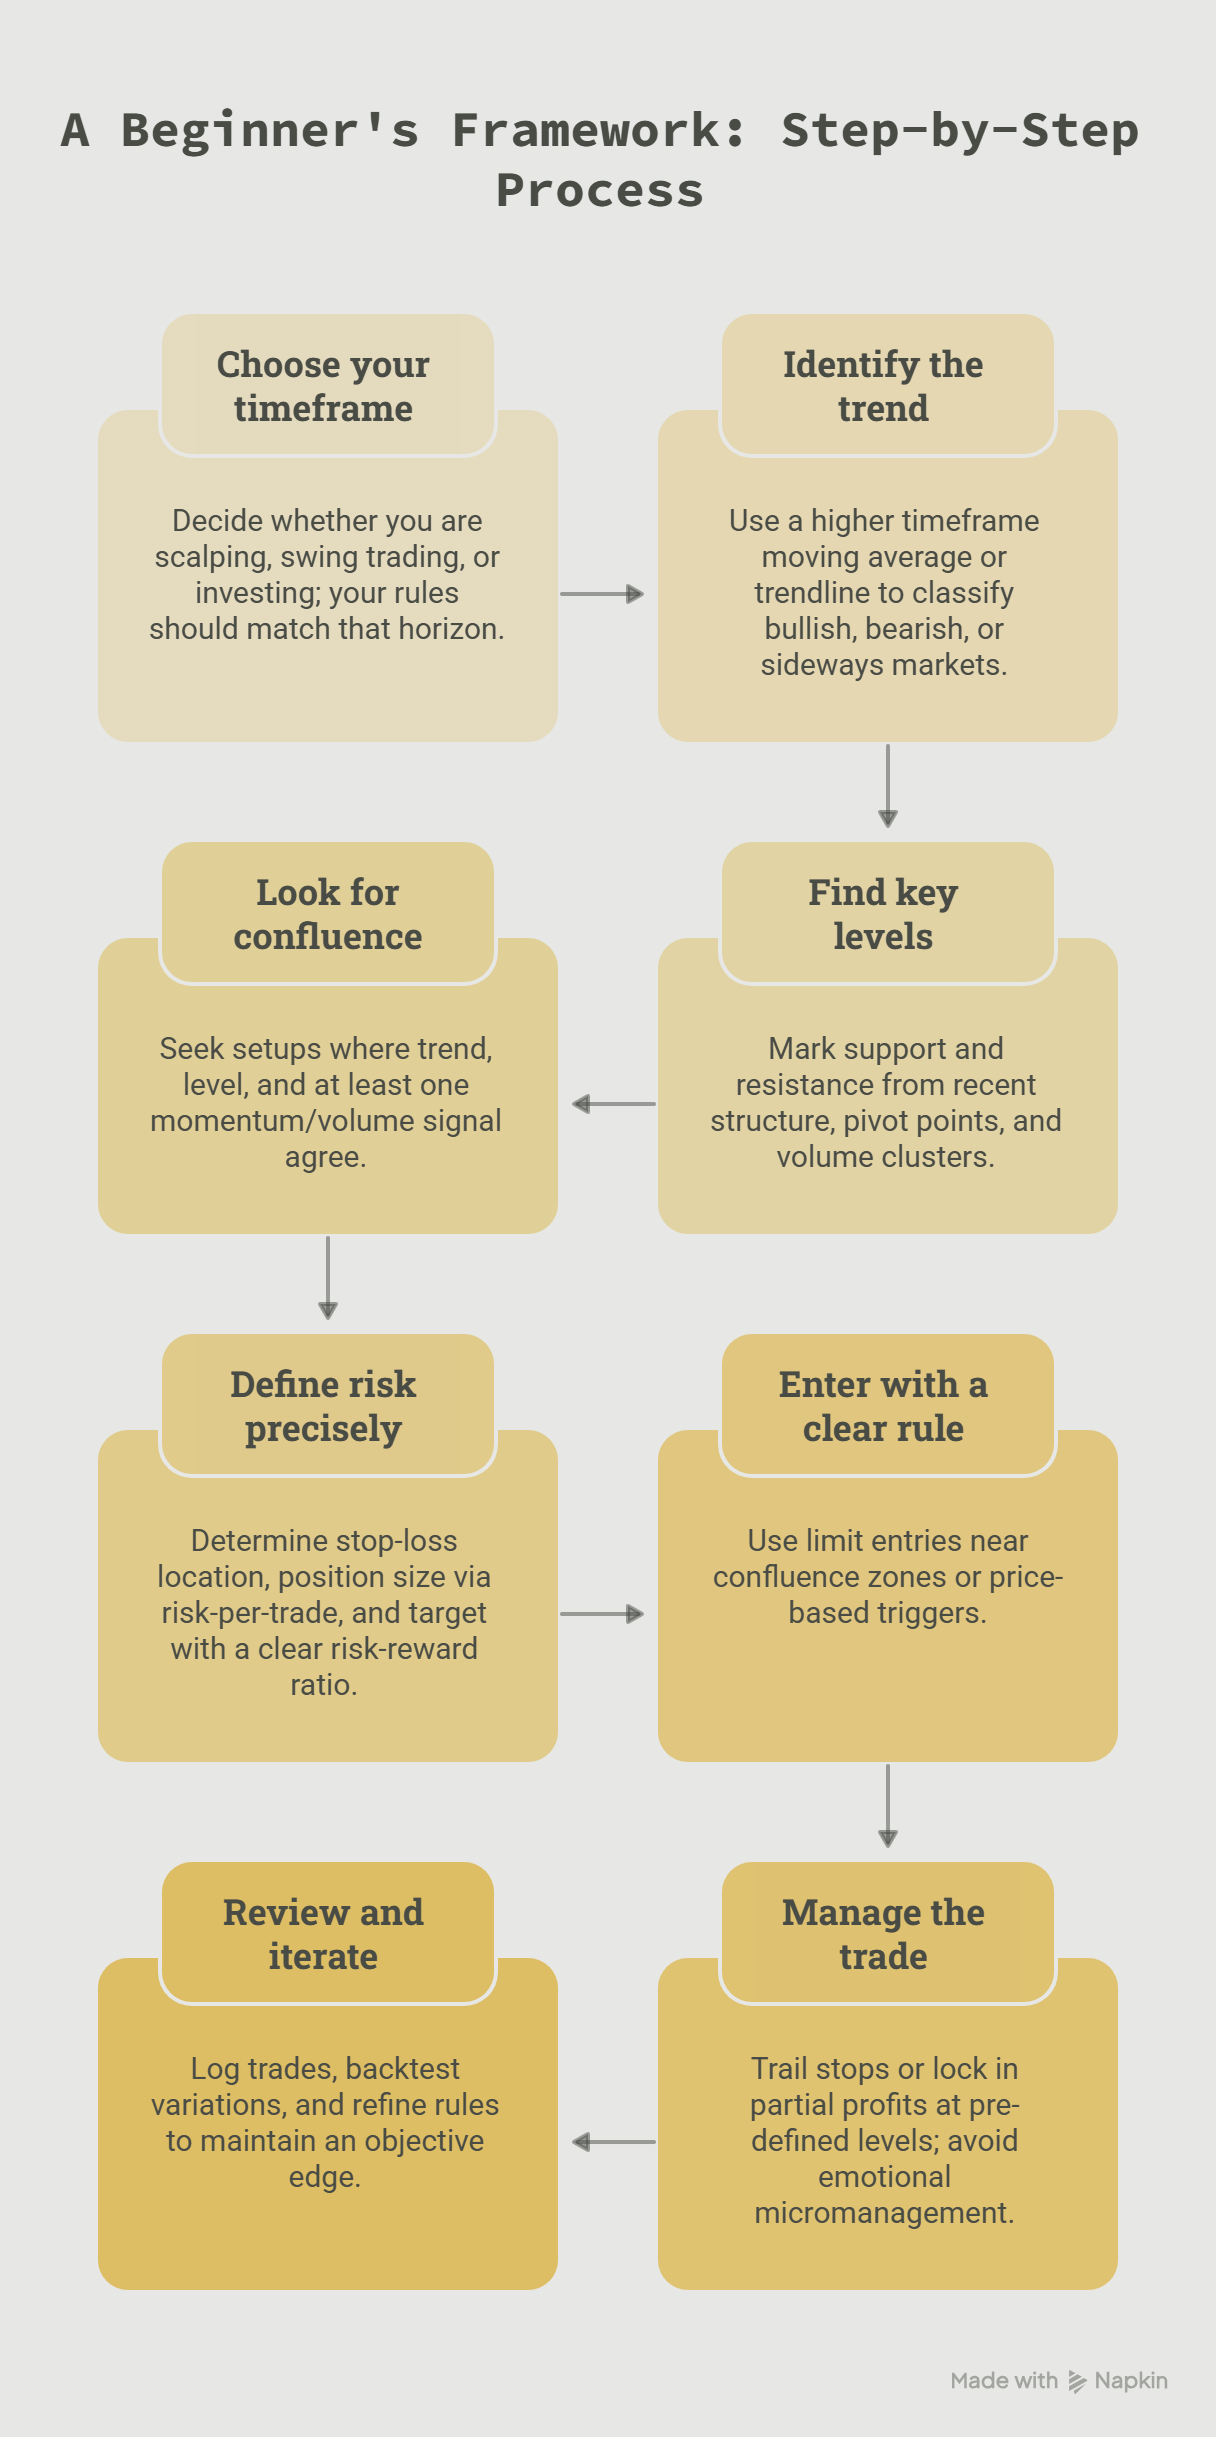
- Choose your timeframe. Decide whether you are scalping, swing trading, or investing; your rules should match that horizon.
- Identify the trend. Use a higher timeframe moving average or trendline to classify bullish, bearish, or sideways markets.
- Find key levels. Mark support and resistance from recent structure, pivot points, and volume clusters.
- Look for confluence. Seek setups where trend, level, and at least one momentum/volume signal agree.
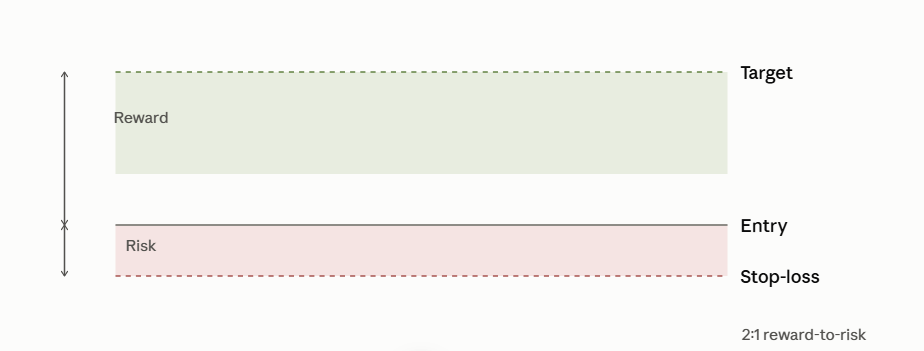
- Define risk precisely. Determine stop-loss location, position size via risk-per-trade, and target with a clear risk-reward ratio.
- Enter with a clear rule. Use limit entries near confluence zones or price-based triggers (e.g., retest of breakout).
- Manage the trade. Trail stops or lock in partial profits at pre-defined levels; avoid emotional micromanagement.
- Review and iterate. Log trades, backtest variations, and refine rules to maintain an objective edge.
Common Patterns and Their Interpretation
Candlestick patterns such as pin bars, engulfing candles, and dojis highlight intraday rejection or acceptance at price levels. Chart patterns — triangles, flags, double tops/bottoms — suggest consolidation or reversal scenarios.
Use pattern context: a bullish continuation pattern inside a strong uptrend has higher odds than the same pattern in a choppy, sideways market. The pattern alone is never the trade; the pattern in context is.
Going Deeper: Smart Money Concepts and ICT
Classical TA has been around for over a century, but in the last decade a related framework has become enormously popular with retail traders: ICT methodology and the broader family of ideas known as Smart Money Concepts. ICT stands for Inner Circle Trader, and the methodology was created by trading educator Michael J. Huddleston, who has shared his concepts publicly since the early 2010s and is widely credited as the original source of the Smart Money Concepts now used by a large global trading community.
The central premise, as sites like FXOpen summarize it, is that ICT explains market movement through institutional behaviour — focusing on liquidity, structure, and order flow rather than conventional indicators. Where classical TA layers oscillators and moving averages onto price, ICT deliberately runs on a clean chart and asks a different question: not “what does the indicator say?” but “what would a large institution need price to do here, and what footprints has it left?”
The core ICT/SMC toolkit includes:
- Market structure — BOS and CHoCH. Bullish structure is a series of higher highs and higher lows; bearish structure is the mirror, lower lows and lower highs. A break of structure (BOS) occurs when price continues in the direction of the existing trend by breaking a key swing point, confirming continuation, while a change of character (CHoCH) flags a potential reversal in that sequence.
- Order blocks. As LiteFinance describes them, order blocks are price zones where large players accumulate positions without causing sharp price moves; they often form near highs or lows, precede reversals, and can provide entry opportunities when price returns to them.
- Breaker blocks. If price breaks through an order block, that zone becomes a breaker block and can act as new support or resistance in the opposite direction.
- Fair value gaps (FVGs). A fair value gap is a three-candle pattern where the middle candle moves so aggressively that it leaves an imbalance — a gap between the first and third candle’s wicks — and price tends to be drawn back to fill these gaps before continuing in the original direction. Because modern markets are generally well-balanced, a sudden imbalance acts like a vacuum the market later corrects.
- Liquidity pools and sweeps. Clusters of stop-losses and pending orders naturally accumulate above obvious highs and below obvious lows. SMC treats these clusters as targets — the idea that institutional traders move price to sweep liquidity at extremes before the real move begins. This is why a sharp wick beyond an obvious level, followed by an immediate reversal, is read as a liquidity grab rather than a genuine breakout.
- Kill zones and session timing. ICT uses kill zones — windows tied to major trading sessions like the London and New York opens — to track when liquidity actually enters the market, while conventional TA methods rarely factor in session timing at all. The same-looking setup carries different odds at 3 a.m. in a dead session versus during an active session open.
A necessary caveat, from my own experience and from the better resources on the topic: ICT involves inherent subjectivity — two traders may mark order blocks or FVGs on the same chart differently, and without systematic backtesting across extended historical data there’s no way to quantify whether your personal interpretation produces a genuine statistical edge. As the trading-analytics site Backtrex notes, a commonly cited minimum is around 200 trades across at least twelve months of data before a strategy’s profit factor can be considered reliable; below that, traders selectively remember winners and forget losers. I treat ICT/SMC concepts as valuable context on top of my classical framework, not as a replacement for it — which brings me back to the theme that ties this whole article together.
Is Chart Analysis the Same as Technical Analysis?
People use these terms interchangeably, and it’s worth answering directly: not quite. Chart analysis is the visual, pattern-reading layer — trendlines, candlestick shapes, and formations like triangles or head-and-shoulders. Technical analysis is the entire discipline that chart analysis sits inside: chart patterns plus indicators, volume analysis, market structure, order-flow concepts like those in ICT/SMC, and the statistical mindset of backtesting and expectancy. You can eyeball a chart pattern without doing technical analysis, but you can’t do complete technical analysis without engaging with the chart. Chart analysis is one ingredient; technical analysis is the whole recipe.
A related question I get: are ICT and SMC just rebranded classical TA? Partly. Support/resistance, breakouts, and trend structure existed long before Huddleston’s terminology. But the emphasis is genuinely different — ICT reframes the same price action through the lens of why institutions might be moving price, and adds a timing dimension (kill zones) that classical TA mostly ignores. It’s less a new discipline and more a regional variation of the same one — which is a perfect segue into the comparison I promised.
The Chai Principle: Why Proportion Beats Ingredients
Here is the comparison that changed how I think about all of the above. Consider how a proper cup of masala chai is made. It is not “tea with milk added.” As recipe writers like The Flavor Bender explain, an authentic masala chai needs a tea base strong enough to stand up to the milk and spices — so unlike a regular cup of tea steeped for three to five minutes, the water, loose tea, and spices are boiled together until the base is robust, and only then is milk added and boiled further with the tea so the two fuse. Other sources, like Alphafoodie, warn about the classic mistakes: adding the milk at the wrong time scalds it, boiling the tea too aggressively releases bitter tannins, and leaving whole spices uncrushed means their oils never properly disperse. Same ingredients, wrong sequence or proportion — ruined cup.
Now map that onto everything I’ve described in this article:
- Water and tea leaves are price and trend — the non-negotiable base. Everything else is built on top of it, and if the base is weak (a trend read taken from too small a timeframe, steeped too briefly), nothing added later can save the result.
- Milk is volume and liquidity — the ingredient that gives the move body. A breakout without volume is a chai where the milk never simmered with the tea: it looks right, but it has no substance and won’t hold together. The SMC obsession with liquidity is really just this principle taken seriously: where is the real participation, versus froth on the surface?
- Spices are your patterns, indicators, and ICT concepts — cardamom, cinnamon, ginger, cloves, pepper. Each one is genuinely useful; all of them at once, in heavy quantities, produce a muddled cup where nothing comes through clearly. This is precisely the indicator-whipsaw problem: five overlapping tools fighting each other. The best chai makers and the best chart readers share the same discipline — a small number of spices, chosen deliberately, each doing one job.
- The boil is timing — ICT’s kill zones, session windows, and the sequence of your analysis. The same spices steeped for two minutes in barely-warm water versus two minutes at a rolling boil produce completely different results; the same chart pattern in a dead session versus an active session open carries completely different odds. Sequence matters too: trend before levels, levels before entry, exactly as milk comes after the base, never before.
- Sugar is risk management — the least glamorous ingredient and the one that decides whether the cup is sustainable. Nobody brags about their sugar measurement, and nobody brags about risking 1% per trade. But too much of it, poured in emotionally mid-trade rather than measured in advance, is the ingredient most linked to long-term damage.
The deeper point of the comparison is this: no single ingredient makes the chai, and no single tool makes the trader. SMC, ICT, classical chart patterns, momentum indicators, timing concepts — every one of them, in the right proportion, in the right sequence, can combine into something reliably good. Any one of them, over-used or used out of sequence, degrades the whole blend. When I catch myself stacking a fifth indicator onto a chart, the mental image of someone dumping the entire spice rack into one saucepan is usually enough to make me stop.
And like any good recipe, the proportions aren’t universal — some people take their chai strong and barely sweet, others milky and sugary. Your blend of timeframe, tools, and risk tolerance should be calibrated to you, but it must be measured deliberately and repeated consistently, not improvised differently every session.
Risk Management and Trading Psychology
Risk control is the most important part of any TA framework — classical, ICT-flavoured, or blended. Define maximum loss per trade, maximum exposure per account, and stick to those rules without exception. Psychological discipline — managing fear and greed — separates consistent traders from those who fail.
Common practical rules: risk 0.5–2% of capital per trade, ensure at least 1.5:1 or 2:1 reward-to-risk, and limit the number of concurrent positions to avoid overexposure. In the chai framing: measure your sugar before the pot goes on the heat, not while you’re drinking.
Backtesting and Creating an Edge
Backtesting lets you quantify how a rule performed historically, but beware of curve-fitting. Use out-of-sample testing and forward testing (paper trading) to validate robustness. A recipe tuned obsessively to one batch of tea leaves tastes wrong with the next batch; a strategy tuned obsessively to one stretch of price history fails the moment conditions shift.
Focus on a handful of measurable metrics: win rate, average win/loss, max drawdown, and expectancy (expected return per trade). A positive expectancy with manageable drawdown defines a usable edge. This applies doubly to discretionary ICT concepts, where — as noted earlier — subjective marking makes untested confidence especially dangerous.
Advanced Insights (Beyond Common Sense)
- Self-fulfilling mechanisms: Because many participants watch the same levels and indicators, those levels often become magnets — this social feedback loop is a core reason TA can work.
- Volume structure often precedes price: High-volume nodes mark institutional interest and can predict where liquidity will be absorbed or rejected.
- Multi-timeframe alignment reduces false signals: A setup that aligns across higher and lower timeframes has a statistically higher probability than one seen only on a single chart.
- Indicators are contextual filters, not decision-makers: An oscillator or moving average should confirm what price action already suggests, otherwise it adds noise and increases false positives.
- Derivatives and liquidity drive modern markets: Futures, options expiries, and large block trades can create price moves that technical levels must respect; reading implied volatility and option flows can improve signal timing.
Troubleshooting: Common Problems and Fixes
Problem: Frequent false breakouts. Fix: I narrow my entries to retests with volume confirmation, or I wait for candle close above/below the level on my preferred timeframe. If a breakout occurs with low volume, I treat it as suspect. In SMC language, many “false breakouts” are actually liquidity sweeps — the wick beyond an obvious level exists precisely to grab the stops resting there — so I now also ask whose liquidity did that move just take? before assuming the breakout was real.
Problem: Indicator whipsaws. Fix: I reduced the number of indicators and only use one momentum and one trend filter. Removing redundant signals reduced confusion and improved trade clarity. This is the overloaded spice rack, fixed the only way it can be fixed: by taking spices out, not adding more.
Problem: Poor position sizing leading to emotional exits. Fix: I automated my position-size calculations and always set the stop before entering. That removed the “how much can I risk?” debate mid-trade.
Problem: Overfitting during backtesting. Fix: I introduced out-of-sample tests and randomization to my backtests. I also simplified entry rules — simpler systems generalize better.
Problem: Inconsistent marking of ICT concepts. Fix: My order blocks and FVGs looked different every day, which made testing meaningless. I wrote explicit mechanical definitions — exactly what qualifies as a valid order block or a valid gap — before opening any chart, so I couldn’t unconsciously cherry-pick zones that fit a move I’d already noticed.
Problem: Trusting kill zones blindly. Fix: I stopped assuming a session window was automatically active and started checking that day’s realized volatility first. Some sessions are quiet regardless of the clock — around holidays, ahead of major news — and a kill zone with no liquidity in it is just a time of day.
Community perspective: “I kept getting false signals until I added higher-timeframe alignment — now my win rate improved” — u/trading_student
If you still struggle, consider these diagnostic steps I use: check your timeframes for alignment, verify volume confirmation, review recent news/liquidity events that may have skewed price, and run a quick trade-log analysis to spot recurring mistakes.
Conclusion
I learned that technical analysis is less about prediction and more about managing probabilities and risk. My framework — identify timeframe and trend, find confluence of levels and indicators, layer in institutional context from ICT/SMC where it genuinely adds information, define risk, and test systematically — keeps my decisions disciplined and repeatable.
Recap of steps: choose your timeframe, determine trend, mark support/resistance, seek confluence, set precise risk and stop, enter with predefined rules, manage the trade, and review results. Following these steps helped me move from guesswork to a measurable approach — and the chai principle keeps me honest along the way: the edge is never in one ingredient, it’s in the blend, the proportion, and the patience to repeat the recipe the same way every time.
If you have questions or want to share your experience with specific indicators, ICT concepts, or setups, leave a comment below — I’d like to hear what worked for you.
Sources referenced
- FXOpen — Inner Circle Trading (ICT) Concepts: What They Are and How They Work
- LiteFinance — ICT Trading Strategy: Complete Guide to Inner Circle Trader Method
- ChartingLens — ICT Trading Strategy: The Complete Guide to Inner Circle Trader Concepts
- Backtrex — ICT Method: Michael Huddleston’s Inner Circle Trader Guide
- eplanetbrokers — ICT Trading: The Ultimate Guide to Inner Circle Trader
- The Flavor Bender — Authentic Masala Chai Recipe
- Alphafoodie — Masala Chai Recipe